Fig. 2
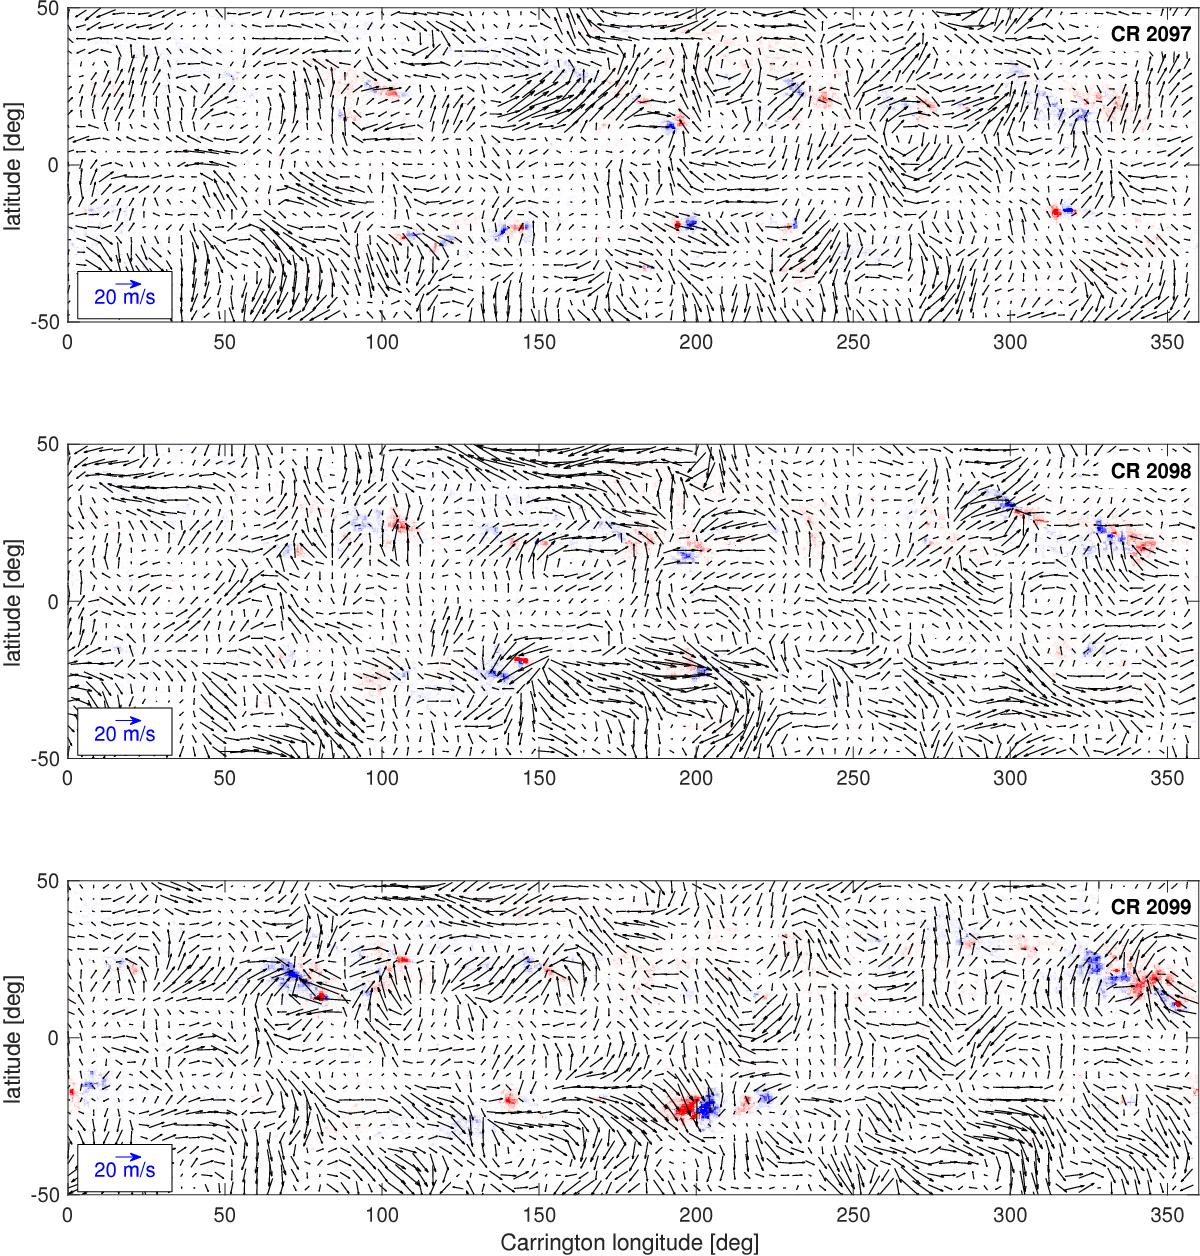
Examples for Carrington maps of flows generated with LCT. The images show the line-of-sight magnetic field, the arrows show the LCT flow velocities with the background signal subtracted. The color scale saturates at ± 100 G. The magnitude of the flow velocities is visualized in the lower left corner of the individual Carrington maps. We show three maps for the quiet Sun (CR 2097 from 20 May to 16 June 2010, CR 2098 from 16 June to 16 July 2010, and CR 2099 from 13 July to 9 August 2010). The rms of the flows is ~ 8 m/s.
Current usage metrics show cumulative count of Article Views (full-text article views including HTML views, PDF and ePub downloads, according to the available data) and Abstracts Views on Vision4Press platform.
Data correspond to usage on the plateform after 2015. The current usage metrics is available 48-96 hours after online publication and is updated daily on week days.
Initial download of the metrics may take a while.