Fig. 1
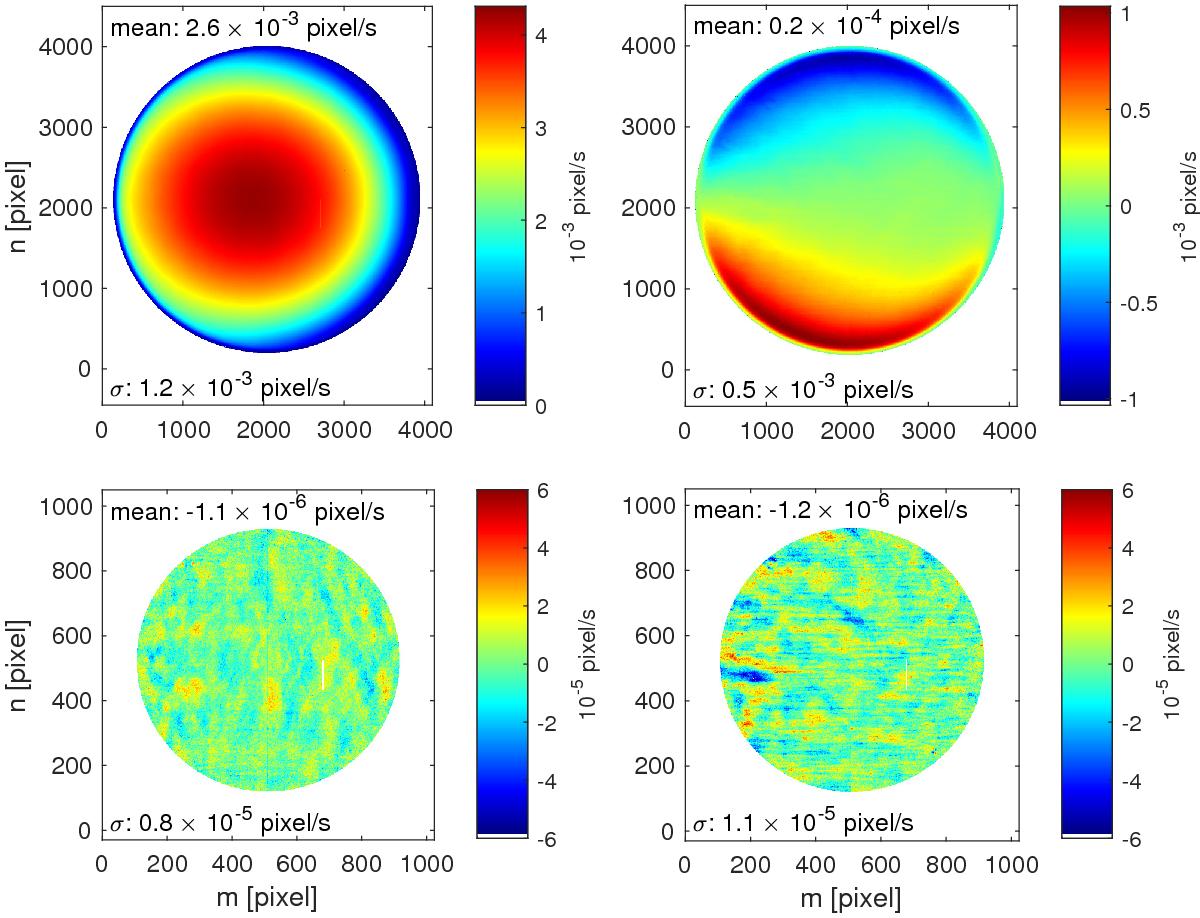
Mean flow maps generated by LCT without subtracting the background (top) and with background subtraction and 4 × 4 subsampling (bottom). Left: flow maps for vm. Right: flow maps for vn. The average consists of data between 24 April 2010 and 27 April 2016. The numbers in the top left of the individual subimages give the mean of the velocity, the numbers in the bottom left the standard deviation across the averaged image. At disk center, 10-5 pixel/s correspond to ~ 3.50 m/s and 10-3 pixel/s to ~ 350 m/s. The CCD of HMI has a bad column (top panels, m = 2727), where the amplitude of the flow velocities in the m-direction are too low. We do not include these data in the analysis. In the bottom panels, we only show data within 60° of the disk center; we do not include data outside 60° in the further analysis.
Current usage metrics show cumulative count of Article Views (full-text article views including HTML views, PDF and ePub downloads, according to the available data) and Abstracts Views on Vision4Press platform.
Data correspond to usage on the plateform after 2015. The current usage metrics is available 48-96 hours after online publication and is updated daily on week days.
Initial download of the metrics may take a while.