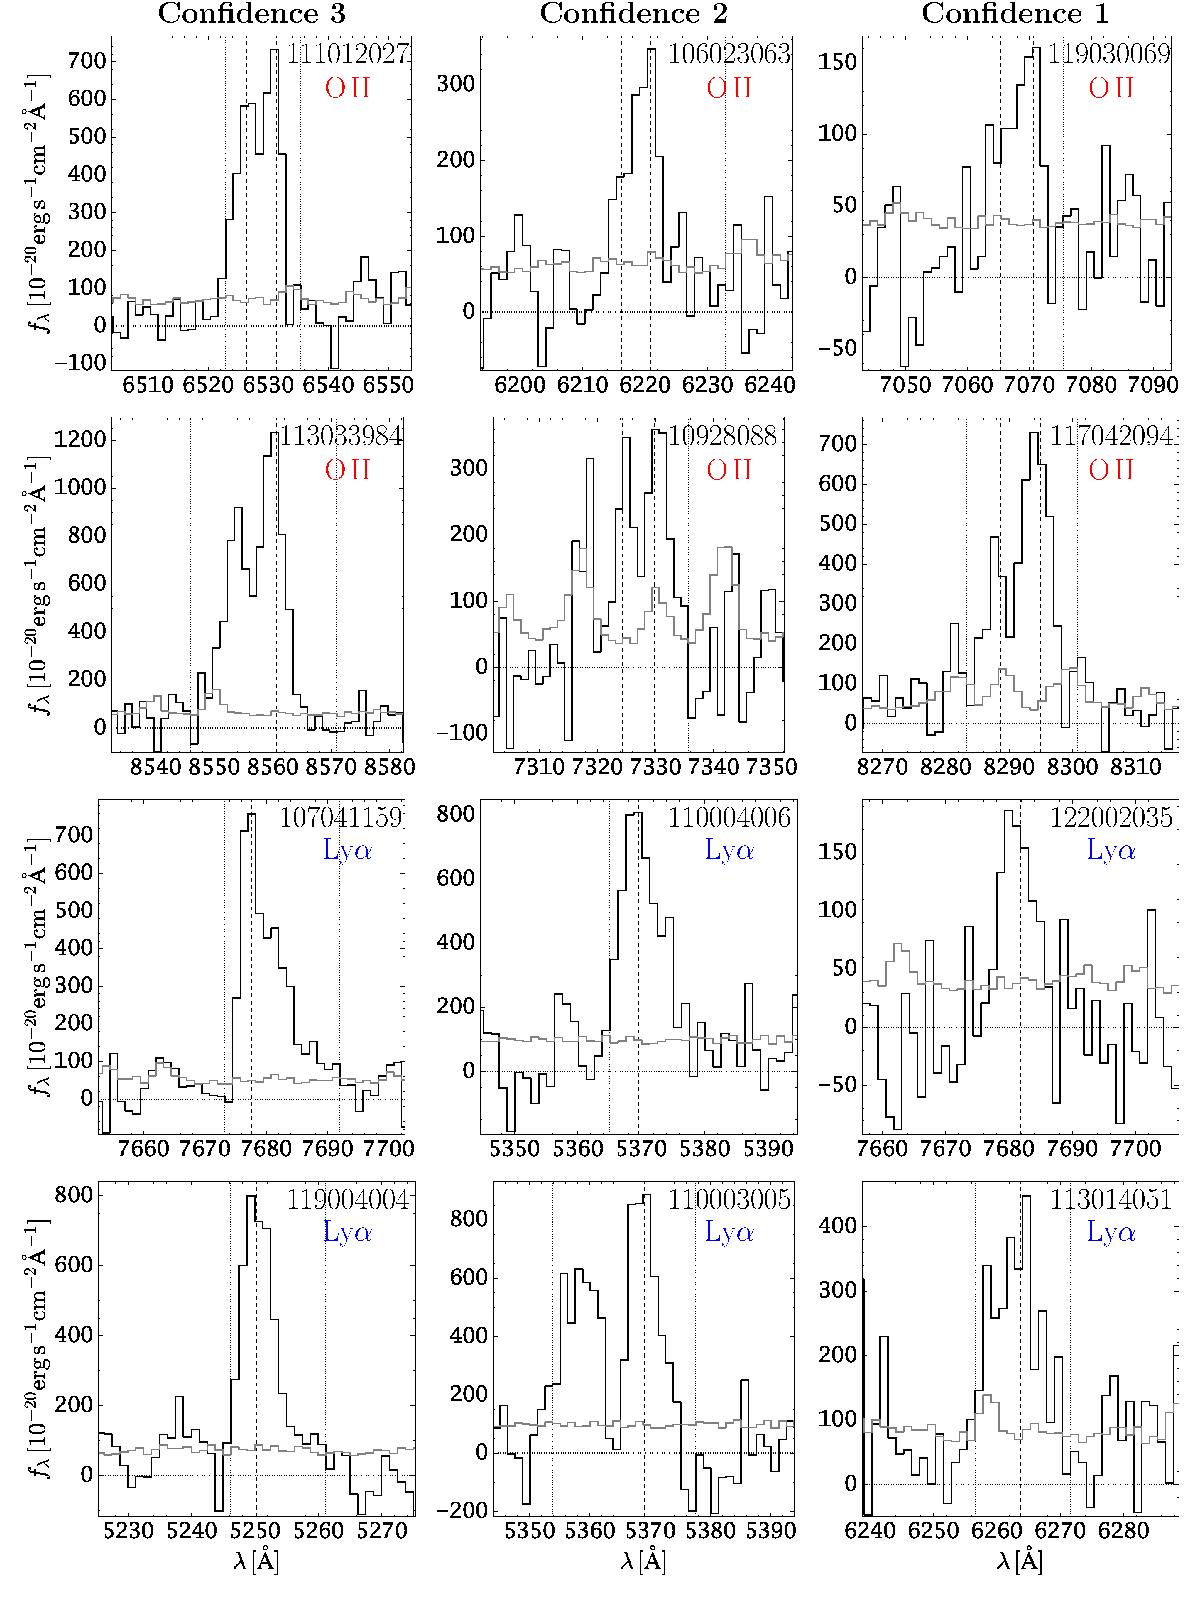
Fig. 8

Six representative [O ii] and Lyα emission line profiles from our sample. The first, second, and third column include objects with confidence flag 3, 2, and 1, respectively. In each panel we show extracted spectra from the datacube in black and their corresponding variances in grey. The dashed vertical lines mark the observed wavelengths of the [O ii] or Lyα emission according to our determined redshift for that object (see Sect. 3.3). The dotted vertical lines mark the window used for flux integration by LSDCat (see Sect. 3.2). In each panel the object’s MUSE-Wide ID (cf. Sect. 4.1) is indicated in the top right corner.
Current usage metrics show cumulative count of Article Views (full-text article views including HTML views, PDF and ePub downloads, according to the available data) and Abstracts Views on Vision4Press platform.
Data correspond to usage on the plateform after 2015. The current usage metrics is available 48-96 hours after online publication and is updated daily on week days.
Initial download of the metrics may take a while.


