Fig. 4
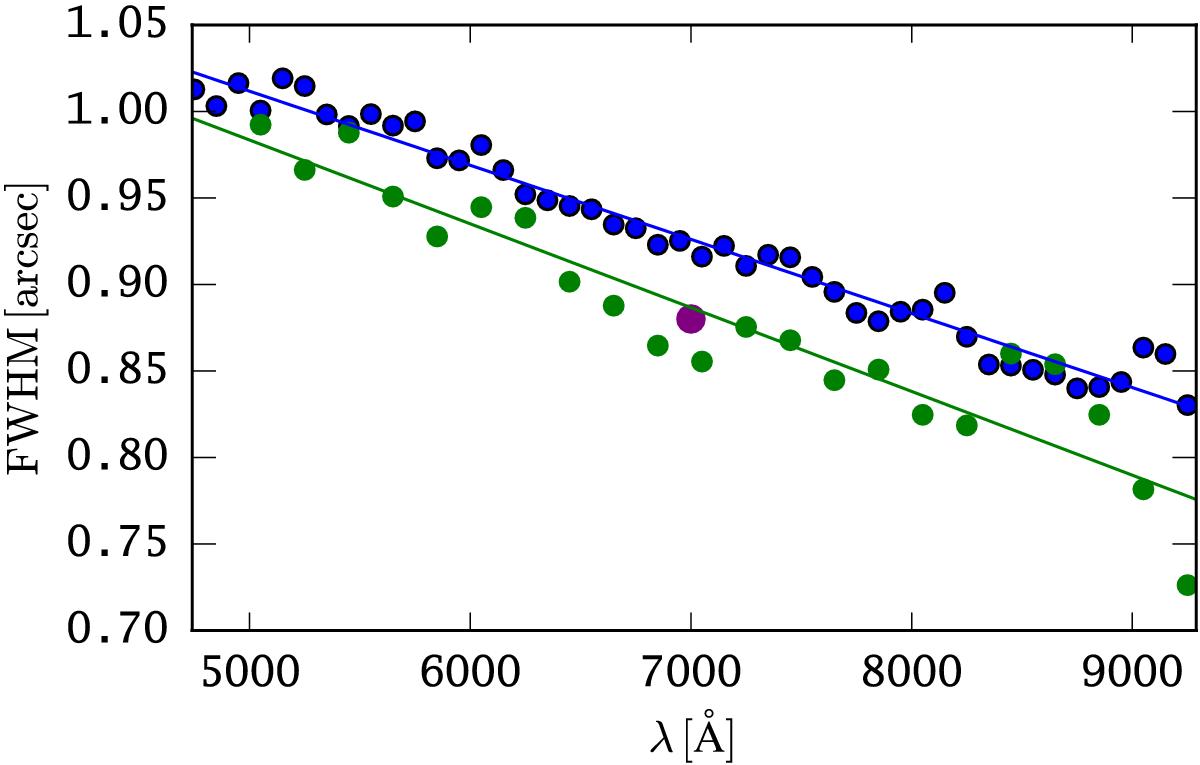
Illustration of the determination of the wavelength dependence of the FWHM of the seeing PSF. As an example we show the results for the MUSE-Wide pointing MUSE-candels-cdfs-14. Blue points show the FWHM values obtained from fitting a 2D Gaussian to images of a star within the datacube. The used images were created by summing over 100 Å along the spectral axis. Green points show the results from minimising the χ2 difference between MUSE images of several compact galaxies within a pointing to 2D Gaussian-convolved and to MUSE resolution resampled HST images of those galaxies. For each image the FWHM of the 2D Gaussian kernel minimising χ2 is displayed. Here the used images are created by summing over 200 Å along the spectral axis. The green and the blue lines are the linear fits FWHM(λ) = p0 + p1(λ−7000 Å) to the individual data points of the FWHM determination using a star or several compact galaxies, respectively. The purple point at 7000 Å is the mean value inferred from the VLT auto guider probe (AG seeing) averaged over all four exposures. As the green points and line are closer to the AG seeing value, we chose this fit to describe the FWHM(λ) dependence.
Current usage metrics show cumulative count of Article Views (full-text article views including HTML views, PDF and ePub downloads, according to the available data) and Abstracts Views on Vision4Press platform.
Data correspond to usage on the plateform after 2015. The current usage metrics is available 48-96 hours after online publication and is updated daily on week days.
Initial download of the metrics may take a while.