Fig. 1
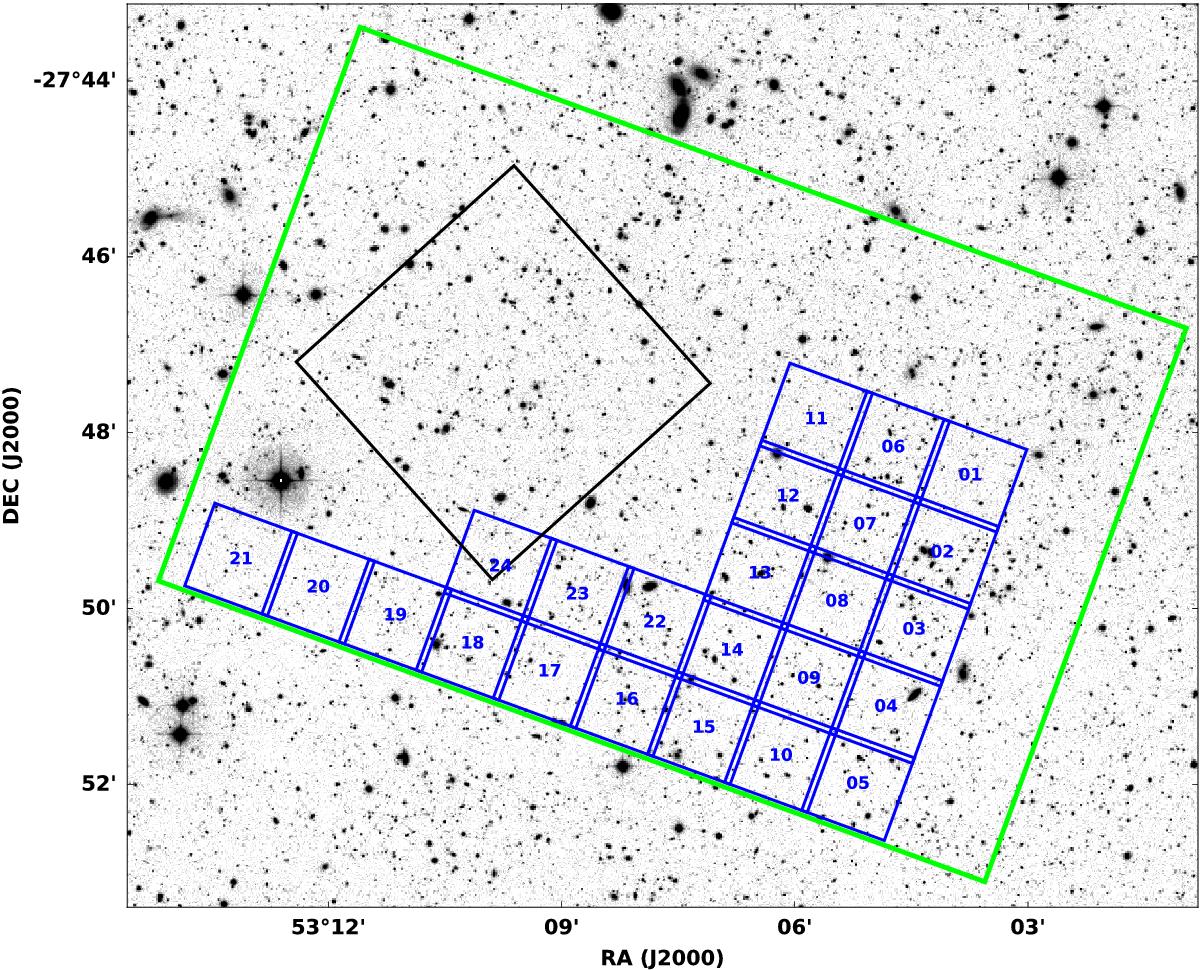
Footprint of the first 24 1′× 1′ pointings of the MUSE-Wide survey in the CANDELS Deep region of GOODS-South (overlaid over the R-Band Image from GaBoDS – Erben et al. 2005; Hildebrandt et al. 2006). The black square indicates the region of the Hubble Ultra Deep Field and the green rectangle outlines the CANDELS Deep region.
Current usage metrics show cumulative count of Article Views (full-text article views including HTML views, PDF and ePub downloads, according to the available data) and Abstracts Views on Vision4Press platform.
Data correspond to usage on the plateform after 2015. The current usage metrics is available 48-96 hours after online publication and is updated daily on week days.
Initial download of the metrics may take a while.