Fig. 9
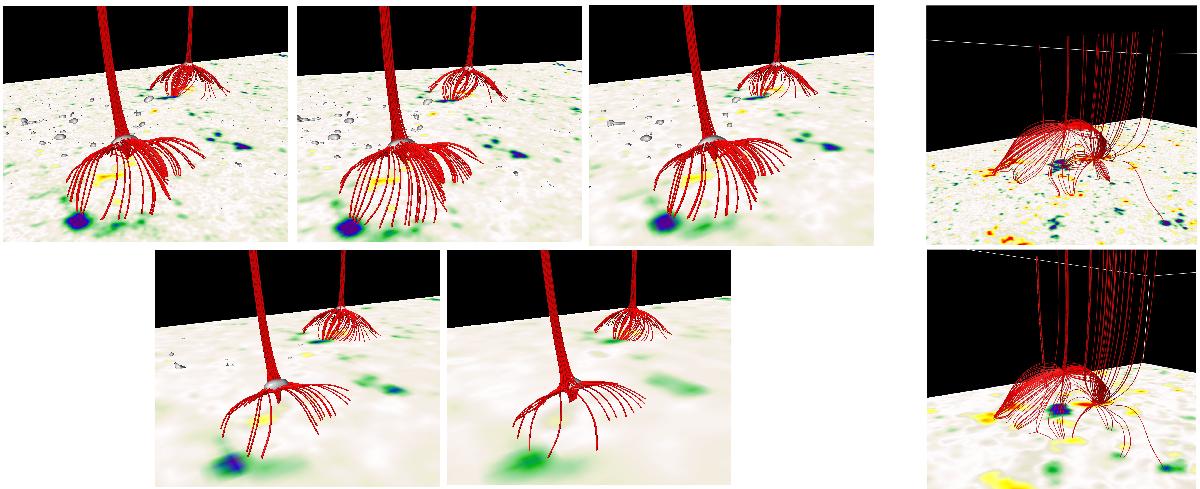
Frames show what happens when pixel resolution of the magnetogram is degraded in a number of steps using a PSF convolution method. The left block of images show the extrapolations based on the original SOT data, and with a factor of 2, 4, 8, and 16 times degradation in spatial resolution for the BP1 and BP2 bright points. The right block of images show the original SOT data and a factor of 16 times lower resolution for the BP8 bright point. The photospheric magnetograms are shown using a ±200 Gauss range; following the standard biasing technique of the VAPOR package, the seeds for the field line tracing are planted at locations with very low values of the total field strength in a box stretching from the photosphere to several Mm height in the BP domain.
Current usage metrics show cumulative count of Article Views (full-text article views including HTML views, PDF and ePub downloads, according to the available data) and Abstracts Views on Vision4Press platform.
Data correspond to usage on the plateform after 2015. The current usage metrics is available 48-96 hours after online publication and is updated daily on week days.
Initial download of the metrics may take a while.