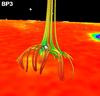
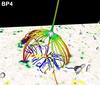
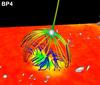
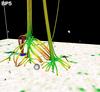
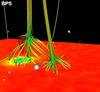
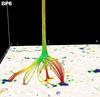
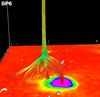
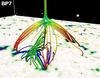
Fig. 4
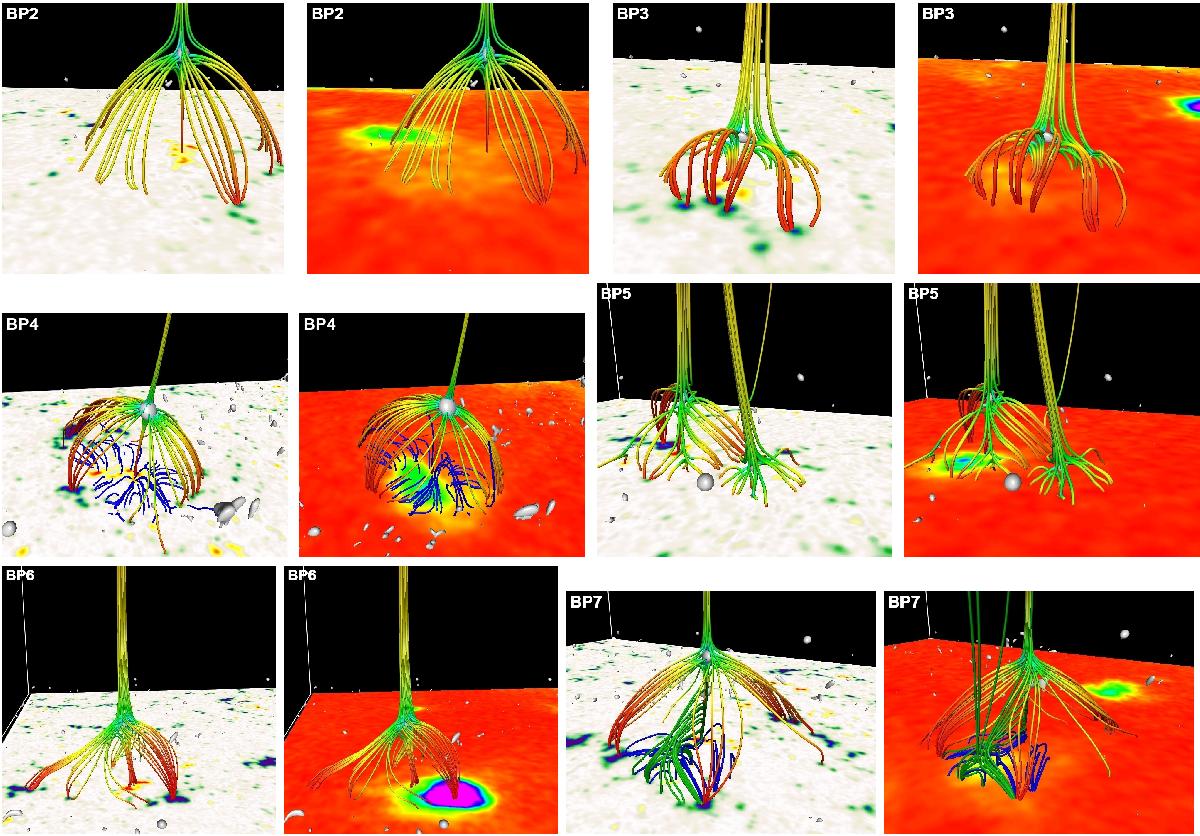
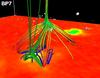
Snapshots of CH bright points BP2–BP7 in pairs of two showing first the surface magnetic field followed by the XRT observations. In both cases the field lines represent the magnetic structure around the null region as in Fig. 2. The times for the frames are BP2 – 14:14:36 UT, BP3 – 10:23:07 UT, BP4 – 06:51:03 UT, BP5 – 06:06:03 UT, BP6 – 05:21:35 UT, and BP7 – 08:06:05 UT on their respective dates, Table 1. In BP4 and BP7 additional single coloured field lines are included to show the local field line structure near the projected X-ray BP regions. The included corresponding online animations show their time evolution.
Current usage metrics show cumulative count of Article Views (full-text article views including HTML views, PDF and ePub downloads, according to the available data) and Abstracts Views on Vision4Press platform.
Data correspond to usage on the plateform after 2015. The current usage metrics is available 48-96 hours after online publication and is updated daily on week days.
Initial download of the metrics may take a while.