Fig. 3
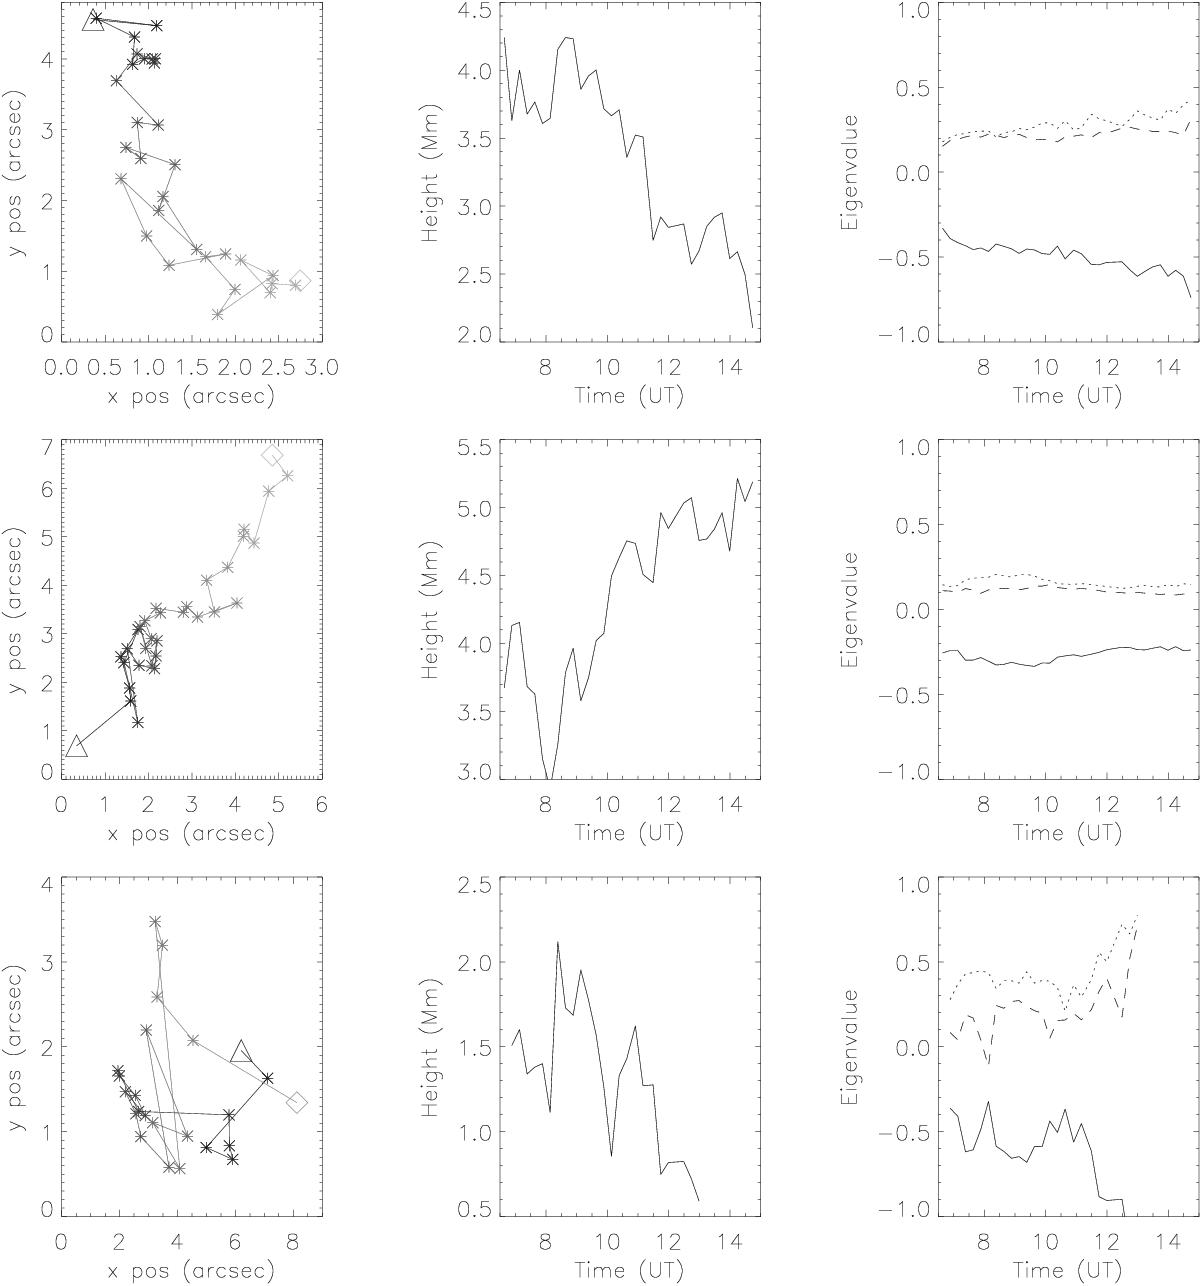
Left column: change in the horizontal null point position relative to a fictive null position for BP1 (top row), BP2 (middle), and BP3 (bottom). The grey shaded stars mark the evolution in time going from black to grey. The first point is marked with a large triangle and the last point with a large diamond. Middle column: height change of the null point. Right column: time dependent change of the null point’s eigenvalues.
Current usage metrics show cumulative count of Article Views (full-text article views including HTML views, PDF and ePub downloads, according to the available data) and Abstracts Views on Vision4Press platform.
Data correspond to usage on the plateform after 2015. The current usage metrics is available 48-96 hours after online publication and is updated daily on week days.
Initial download of the metrics may take a while.