Fig. 7
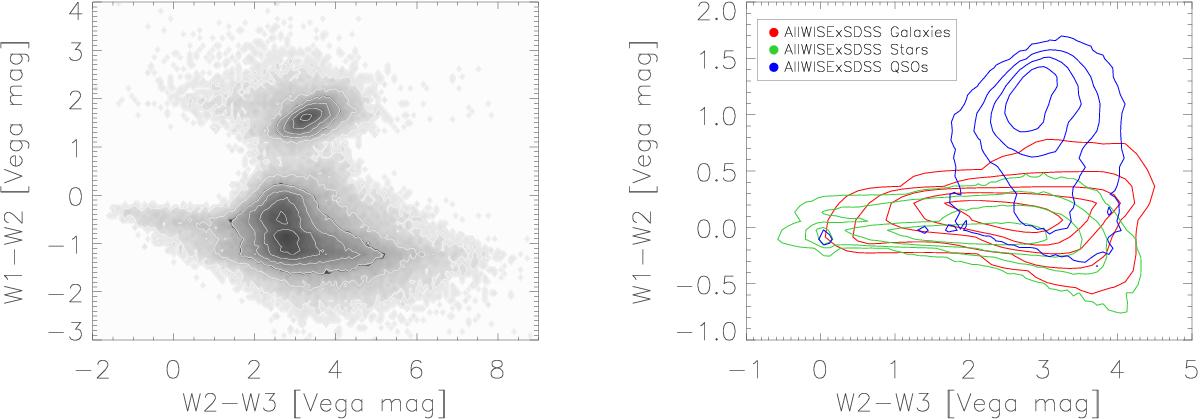
Left panel: WISE colour–colour (W1−W2 vs. W2−W3) diagram for the sources identified by OCSVM as outliers in AllWISE. The plot shows only sources detected in the W3 band (188 496 objects comprising 38% of all the anomalies). The grey scale marks the density of displayed points in linear bins. Right panel: W1−W2 vs. W2−W3 diagram for AllWISE×SDSS sources used for OCSVM training. We note the different ranges of the axes in the two panels.
Current usage metrics show cumulative count of Article Views (full-text article views including HTML views, PDF and ePub downloads, according to the available data) and Abstracts Views on Vision4Press platform.
Data correspond to usage on the plateform after 2015. The current usage metrics is available 48-96 hours after online publication and is updated daily on week days.
Initial download of the metrics may take a while.