Fig. 15
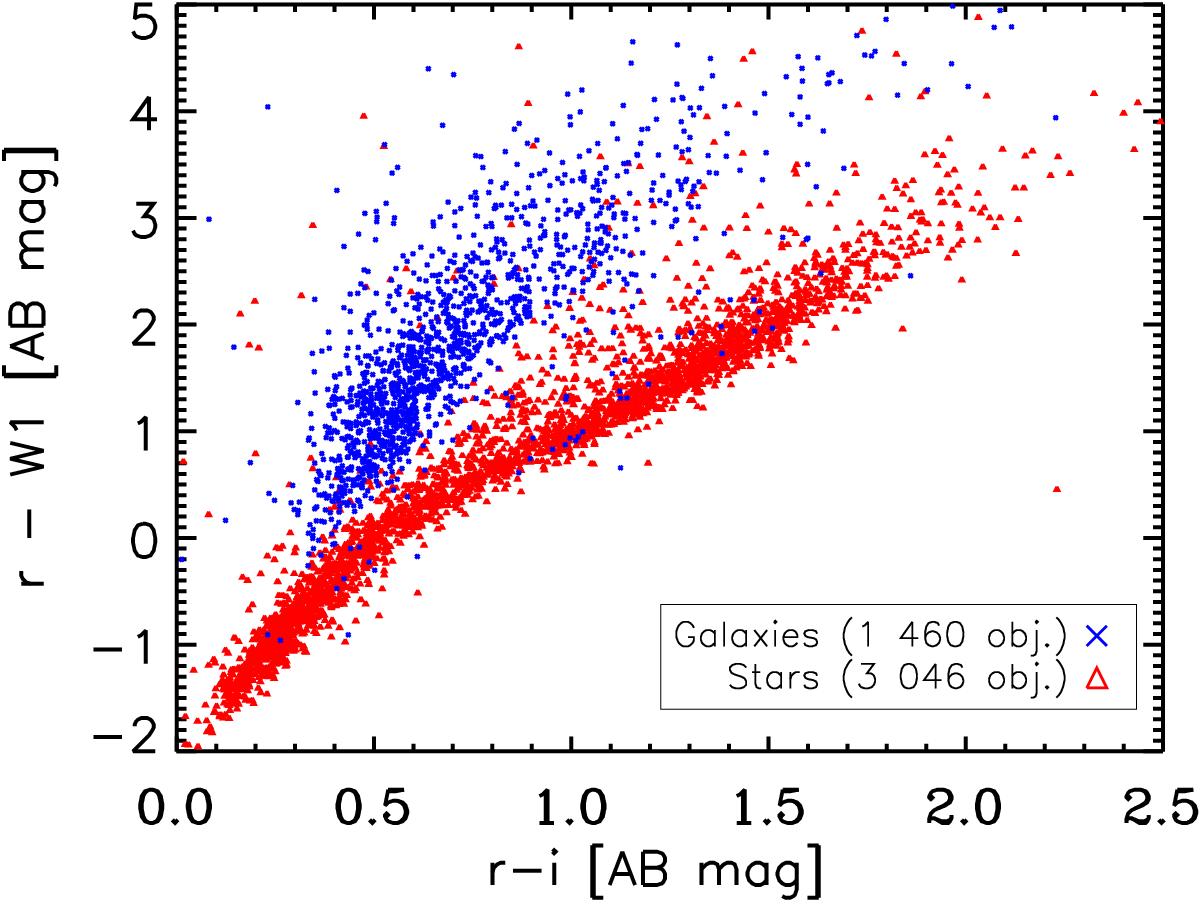
Optical-infrared colour-colour diagram for sources in the AllWISE anomaly sample with intermediate 0 ≤ W1−W2 < 0.8 and also present in the SDSS photometric dataset. Blue and red dots are respectively stars and galaxies according to SDSS morphological classification. All magnitudes are here AB; WISE W1 was converted following Jarrett et al. (2011).
Current usage metrics show cumulative count of Article Views (full-text article views including HTML views, PDF and ePub downloads, according to the available data) and Abstracts Views on Vision4Press platform.
Data correspond to usage on the plateform after 2015. The current usage metrics is available 48-96 hours after online publication and is updated daily on week days.
Initial download of the metrics may take a while.