Fig. A.2
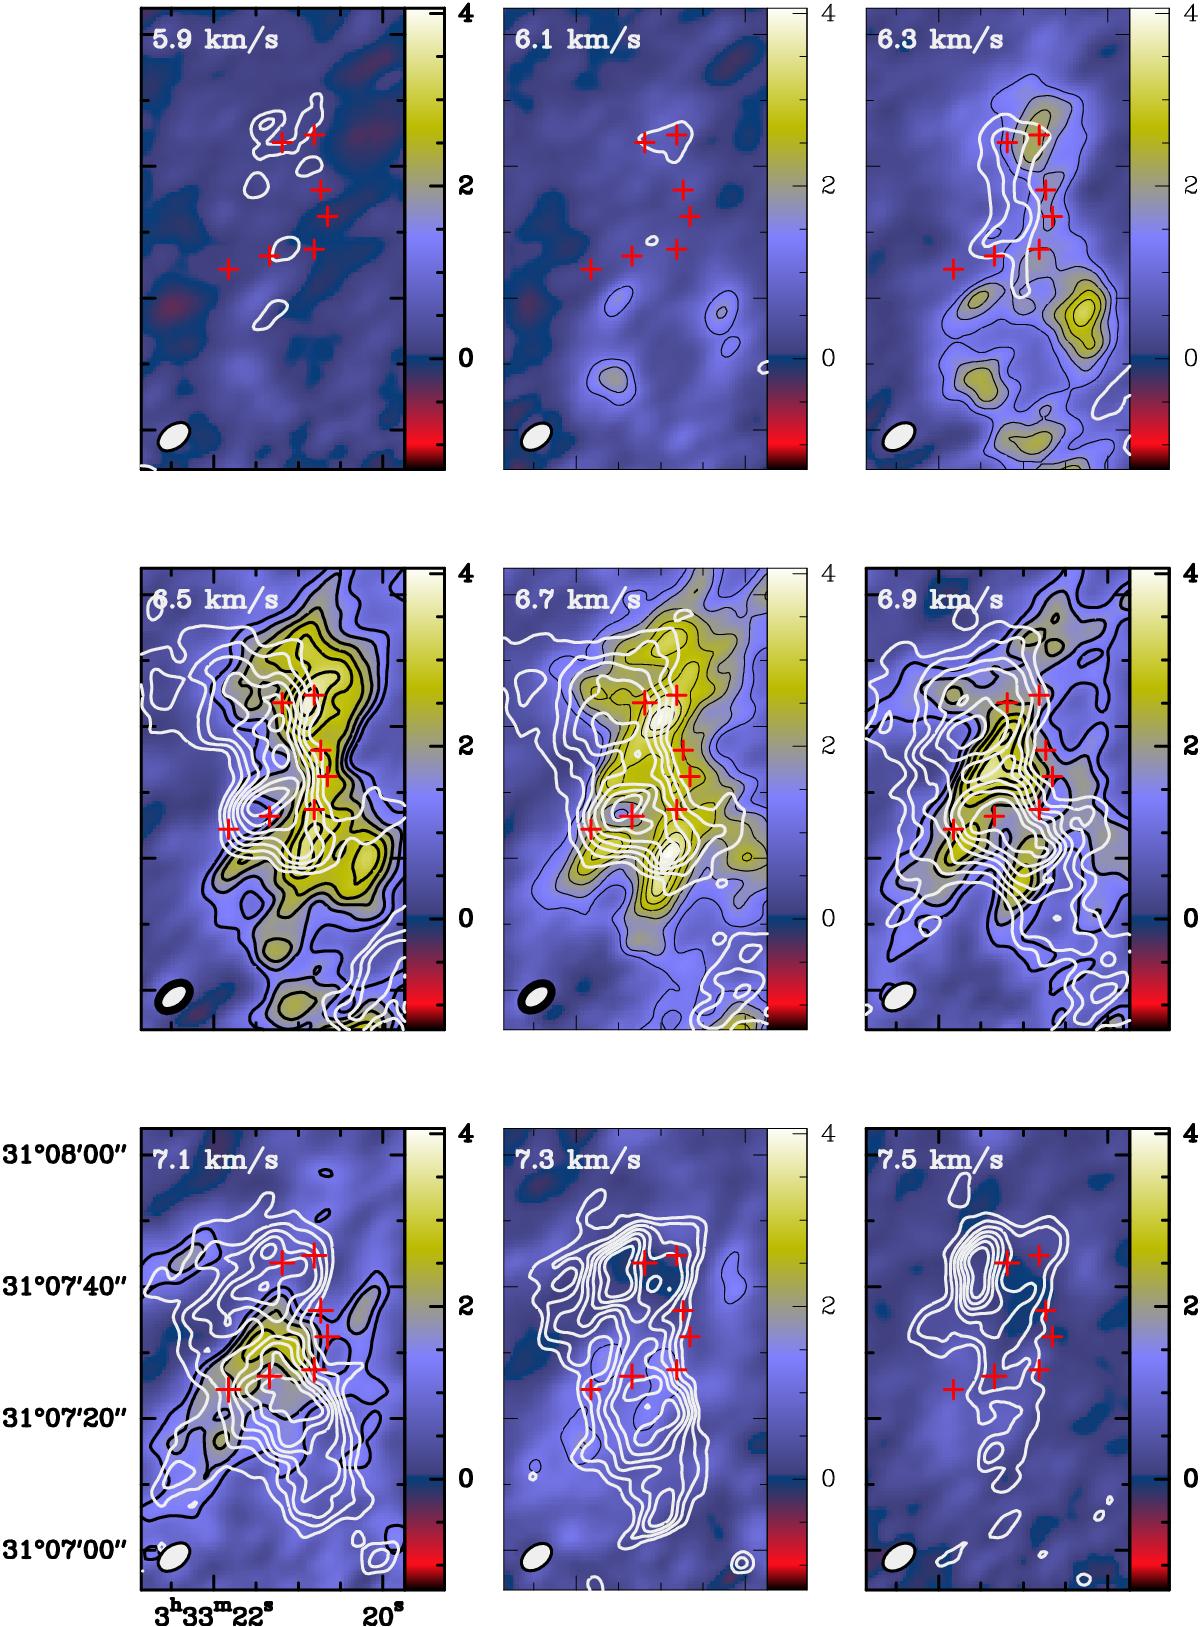
Channel maps of the emission of the SO 32→ 21 (color map) and the main component of the NH2D 11,1a→ 10,1s (white contours) lines. The images have been created by merging the NOEMA data with the short spacing obtained with the IRAM 30 m telescope. The channel velocity is marked at the top of the panel. Red crosses indicate the positions studied in detail in this Letter.
Current usage metrics show cumulative count of Article Views (full-text article views including HTML views, PDF and ePub downloads, according to the available data) and Abstracts Views on Vision4Press platform.
Data correspond to usage on the plateform after 2015. The current usage metrics is available 48-96 hours after online publication and is updated daily on week days.
Initial download of the metrics may take a while.