Fig. 2
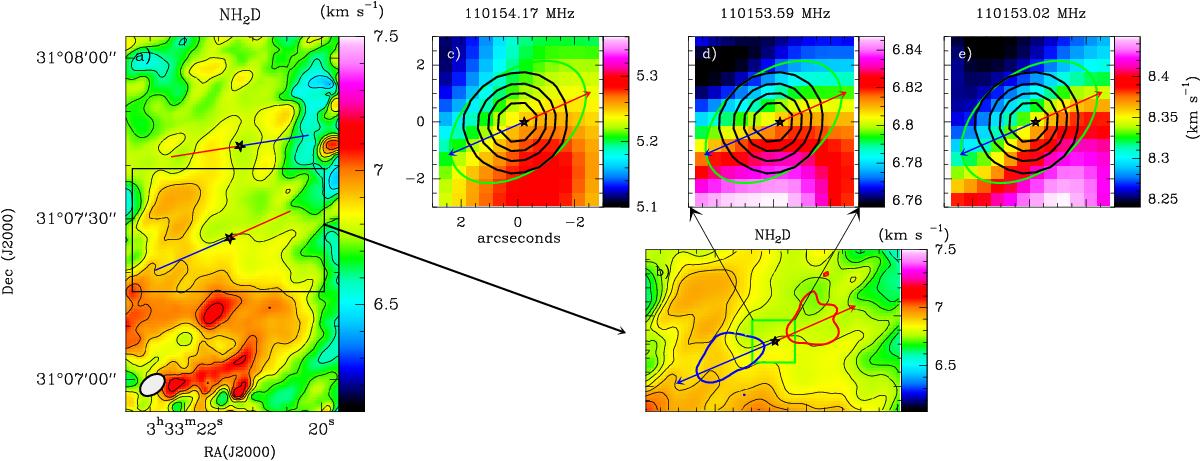
Panel a: first-order moment map of the hyperfine component of the NH2D line at 110 153.59 MHz. The stars indicate the positions of B1b-N and B1b-S. Blue and red arrows mark the outflow directions. Panel b: zoom around B1b-S of the image shown in a). Panels c, d, and e: are the first-order moment maps of the hyperfine components at the of 110 154.17, 110 153.59, and 110 153.03 MHz in a region of 3″ × 3″ around B1b-S. The same velocity pattern is observed in the three components, which corroborates that the velocity gradient observed in the main component is not an artifact due to self-absorption, but the signature of the pseudo-disk rotation. The green ellipse around the star indicates the beam size, and dark black contours correspond to the continuum emission at 145 GHz reported by Gerin et al. (2015). Continuum contour levels are 20% to 90% in steps of 20% of the peak emission.
Current usage metrics show cumulative count of Article Views (full-text article views including HTML views, PDF and ePub downloads, according to the available data) and Abstracts Views on Vision4Press platform.
Data correspond to usage on the plateform after 2015. The current usage metrics is available 48-96 hours after online publication and is updated daily on week days.
Initial download of the metrics may take a while.