Fig. 1
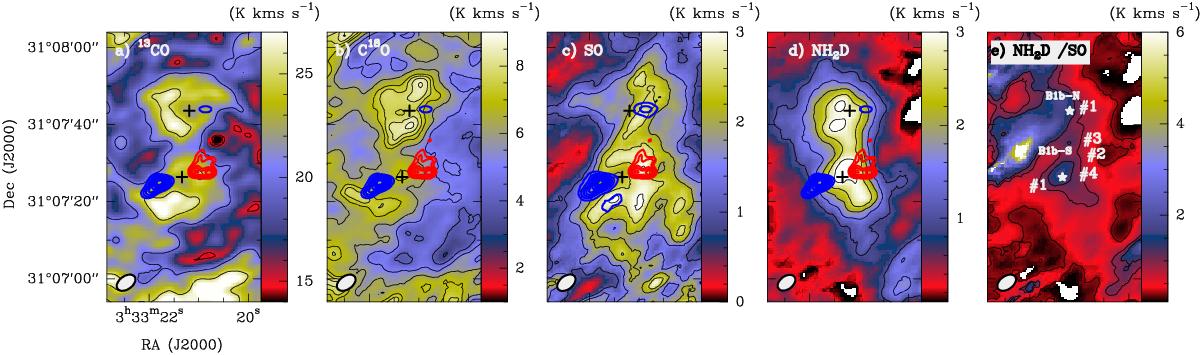
Panel a: integrated intensity image (NOEMA+30 m) of the 13CO 1 → 0 line. Contour levels are 15 (≈150 ×σ), 20, and 25 K km s-1. Crosses indicate the positions of B1b-N and S. The blue and red contours correspond to the blue and red lobes of the B1b-N and S bipolar outflows as traced by the H2CO emission published by Gerin et al. (2015). The beam is plotted in the left bottom corner. Panel b: the same as a) for the C18O 1 → 0 line. Contour levels are 4 (≈40 ×σ), 5, 6, 7, 7.5, 8, and 8.5 km s-1. Panel c: the same as a) for the SO 32→ 21 line. Contour levels are 1 (≈10 ×σ) to 8 in steps of 0.5 K km s-1. Panel d: the same as a) for the integrated intensity of all the hyperfine components of the NH2D 11,1a→ 10,1s line. Contour levels are 1 (≈10 ×σ) to 8 in steps of 0.5 K km s-1. Panel e: I(NH2D)/I(SO) integrated intensity ratio (ratio between the images in panels d and c). The spectra toward the positions labeled in this panel are shown in Fig. A.1.
Current usage metrics show cumulative count of Article Views (full-text article views including HTML views, PDF and ePub downloads, according to the available data) and Abstracts Views on Vision4Press platform.
Data correspond to usage on the plateform after 2015. The current usage metrics is available 48-96 hours after online publication and is updated daily on week days.
Initial download of the metrics may take a while.