Fig. 5
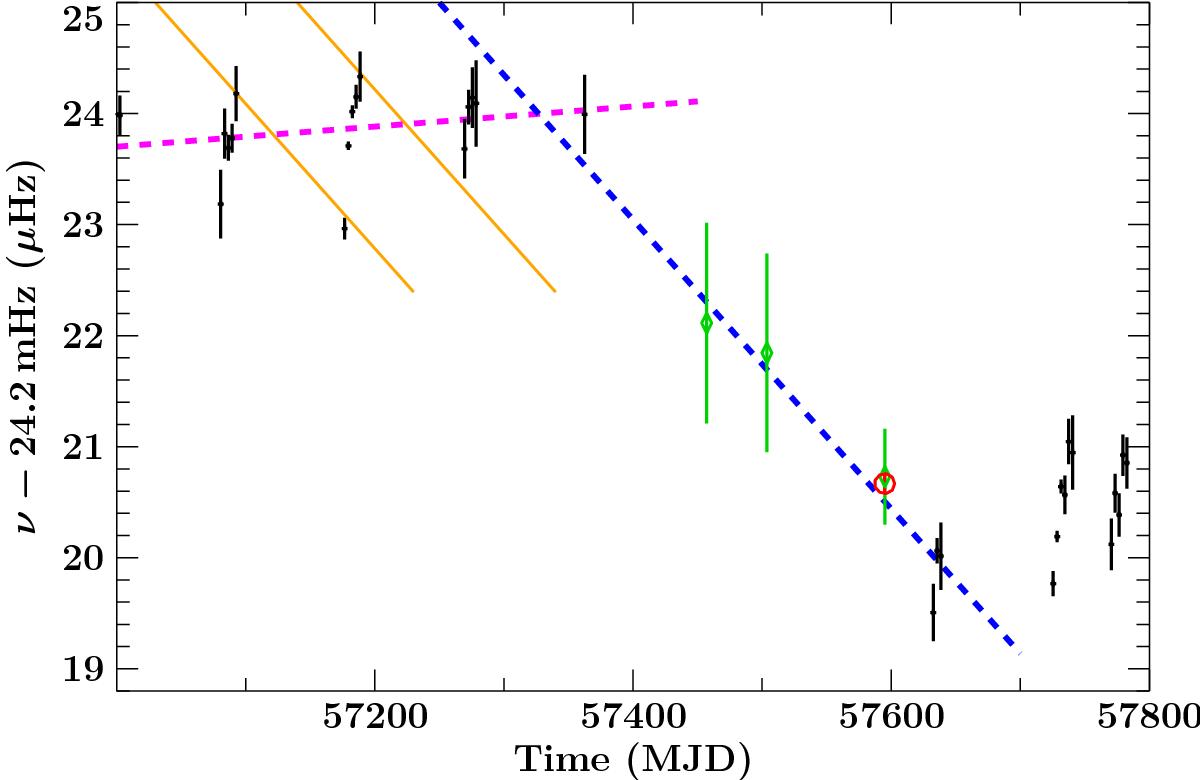
Pulse frequency evolution of EXO 2030+375, as measured with Fermi/GBM. The NuSTARmeasurement is shown as a red circle, the Swiftmeasurements are shown as green diamonds. Each group of black data points corresponds to one Type Ioutburst visible to GBM. During each outburst, the source spins up, while between outbursts it spins down again. With the start of the quiescence period, a continuous spin-down started. The dashed lines are linear regression fits to the active phase, which shows a secular spin-up trend (magenta), and to the spin-down in quiescence (blue), respectively. The orange solid lines have the same slope as the best-fit spin-down linear regression to guide the eye between the spin-up episodes during outbursts. The data after MJD 57 700.0 show that with the again stronger outbursts, EXO 2030+375is also starting to spin-up again.
Current usage metrics show cumulative count of Article Views (full-text article views including HTML views, PDF and ePub downloads, according to the available data) and Abstracts Views on Vision4Press platform.
Data correspond to usage on the plateform after 2015. The current usage metrics is available 48-96 hours after online publication and is updated daily on week days.
Initial download of the metrics may take a while.