Fig. 4
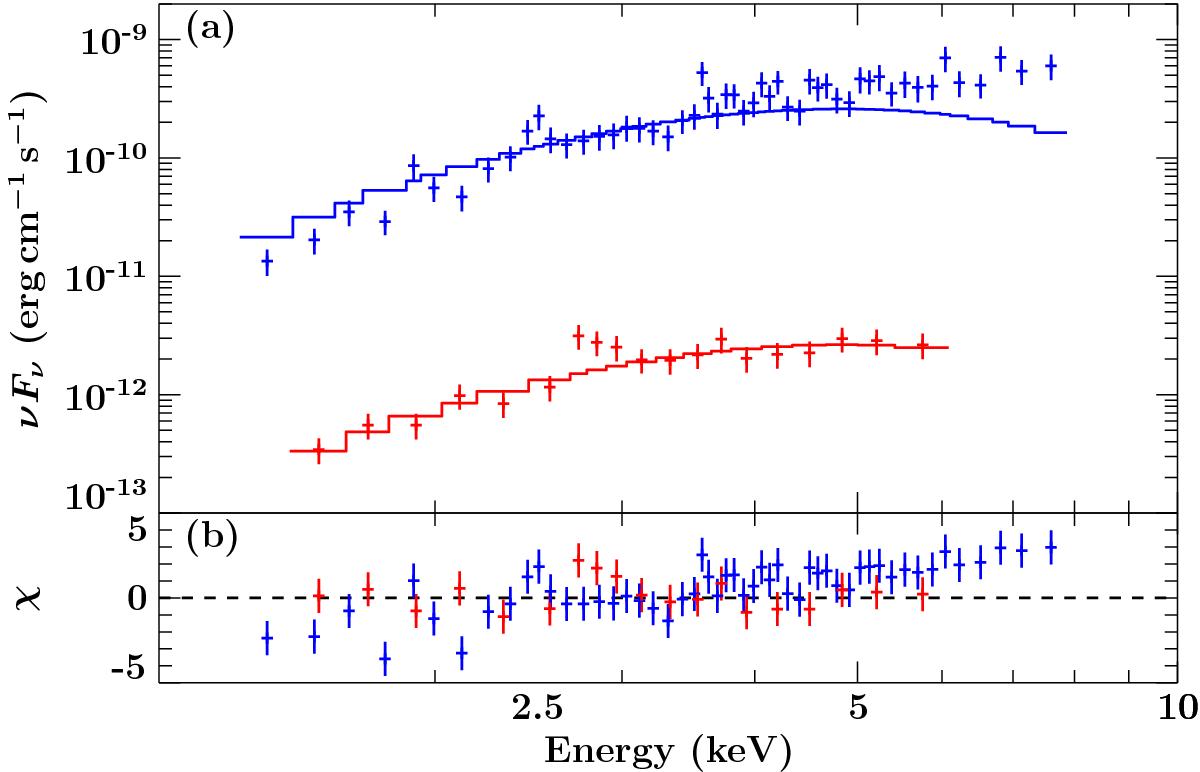
Swift/XRT spectra and residuals of the combined faint states (red) and during a single bright observation (ObsID 00030799031, blue). The model is the best-fit blackbody spectrum fitted to the faint state (see Table 2), and only scaled in flux to match the brighter state. The brighter state is clearly harder than the faint data.
Current usage metrics show cumulative count of Article Views (full-text article views including HTML views, PDF and ePub downloads, according to the available data) and Abstracts Views on Vision4Press platform.
Data correspond to usage on the plateform after 2015. The current usage metrics is available 48-96 hours after online publication and is updated daily on week days.
Initial download of the metrics may take a while.