Fig. 3
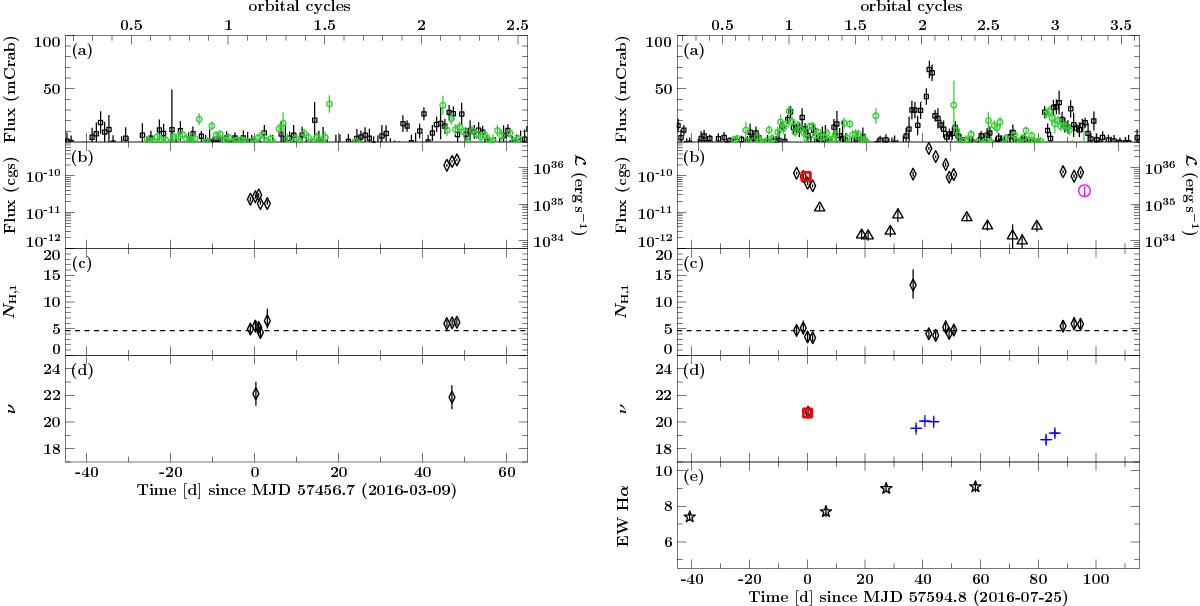
Panel a: Swift/BAT (black) and MAXI (green) fluxes in mCrab from March to May 2016 (left) and July to October 2016 (right). The fluxes were rescaled to the respective mCrab count-rates, using 0.00022 cts s-1 cm-2 (15–50 keV) for BAT and 0.0033 cts s-1 cm-2 (2–20 keV) for MAXI. Panel b: Flux measured in the 3–10 keV energy band in units of erg cm-2 s-1. For the data points shown as triangles the absorption was frozen to 5.9 × 1022 cm-2 as it could not be constrained due to the low S/N. Furthermore, no pulsation search could be performed on those data for the same reason. The NuSTARflux is shown by a red square and the INTEGRAL/ISGRI flux is shown by a magenta circle and measured between 25–40 keV. The y-axis is scaled logarithmically. The right hand y-scale gives the implied spherical luminosities for a distance of d = 7.1 kpc. Panel c: Global absorption column NH,1 measured with Swift/XRT in 1022 cm-2. The columns of NuSTARand ISGRI were tied to the closest XRT point and are therefore not shown. Panel d: Pulse frequency ν−24.2 mHz in μHz. Blue crosses are values measured by Fermi/GBM, black diamonds are from Swift/XRT, and the red square is the NuSTARvalue. Panel e: Equivalent width of the Hα line, as measured in the NOT/ALFOSC spectra.
Current usage metrics show cumulative count of Article Views (full-text article views including HTML views, PDF and ePub downloads, according to the available data) and Abstracts Views on Vision4Press platform.
Data correspond to usage on the plateform after 2015. The current usage metrics is available 48-96 hours after online publication and is updated daily on week days.
Initial download of the metrics may take a while.