Fig. 2
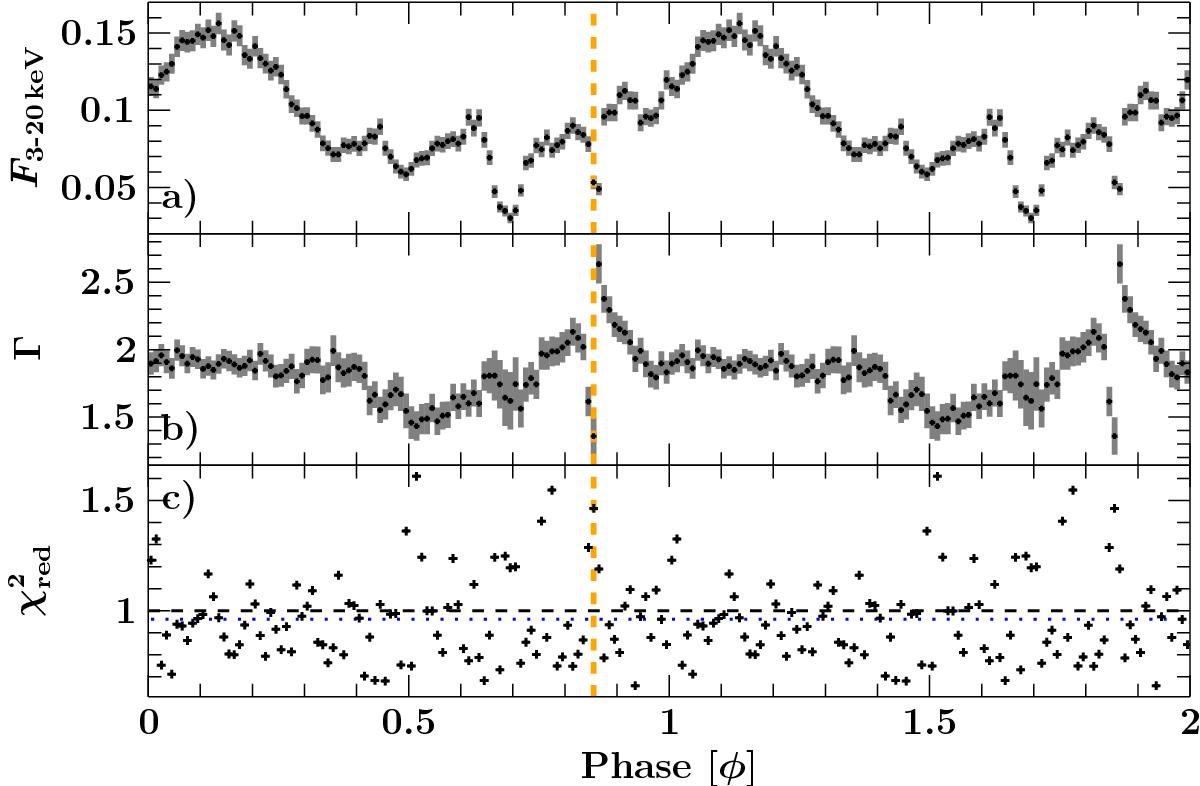
Results of the phase-resolved spectral fits using 100 phase-bins with NuSTARdata only. Panel a: Flux between 3–20 keV in keV cm-2 s-1. Panel b: Photon index. All other continuum parameters were frozen to the phase-averaged value. The orange dashed line indicates the dip to guide the eye. Panel c: ![]() value for each phase-bin. The blue dotted line indicates the average
value for each phase-bin. The blue dotted line indicates the average ![]() overall bins.
overall bins.
Current usage metrics show cumulative count of Article Views (full-text article views including HTML views, PDF and ePub downloads, according to the available data) and Abstracts Views on Vision4Press platform.
Data correspond to usage on the plateform after 2015. The current usage metrics is available 48-96 hours after online publication and is updated daily on week days.
Initial download of the metrics may take a while.