Fig. 8
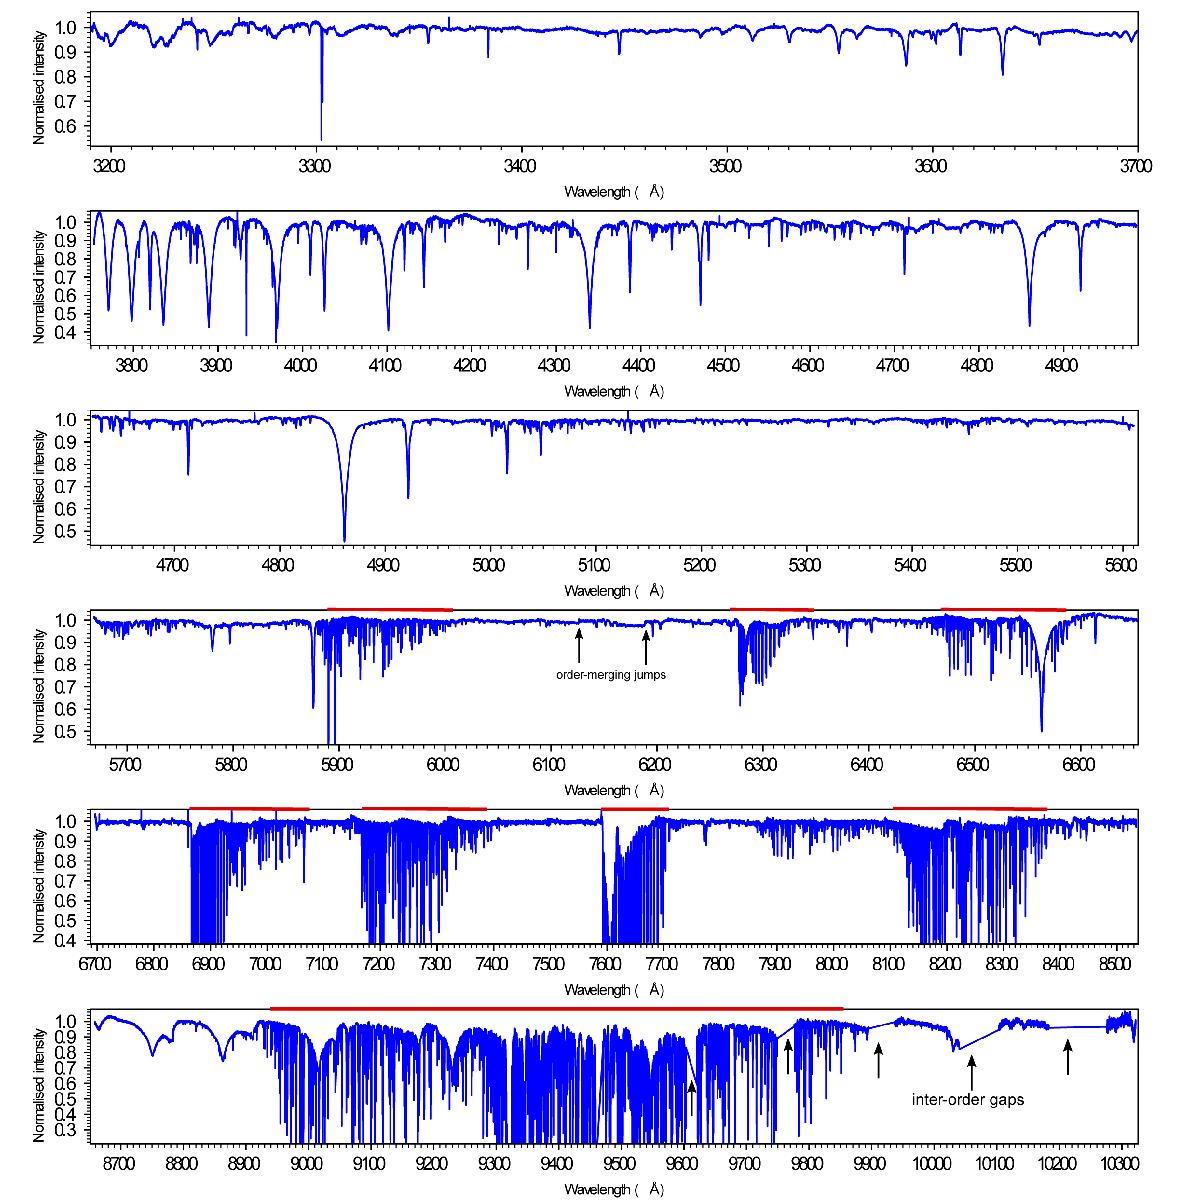
EDIBLES UVES spectra of HD 170740 (B2 V) for each setting from top to bottom: 346B, 437B, 564L, 564U, 860L, 860U. This overview figure is a demonstration of the data quality. The main gaps in wavelength coverage are between 5610–5670 Å and 8530–8680 Å which correspond to the physical separation of the Red-L and Red-U detectors in both the 564 and 860-nm settings. Note also the inter-order gaps, several are indicated with arrows, in the 860-nm Red-U spectrum above ~9600 Å as well as several conspicuous regions containing bands of closely-spaced telluric absorption lines (indicated with red horizontal bars) mostly in the Red-L and Red-U 860-nm spectra (bottom two panels). Two order-merging jumps are indicated in the fourth panel. A more detailed version of this figure is shown in Fig. B.1 where specific interstellar species are labeled and a synthetic DIB spectrum is shown for comparison.
Current usage metrics show cumulative count of Article Views (full-text article views including HTML views, PDF and ePub downloads, according to the available data) and Abstracts Views on Vision4Press platform.
Data correspond to usage on the plateform after 2015. The current usage metrics is available 48-96 hours after online publication and is updated daily on week days.
Initial download of the metrics may take a while.