Fig. 6
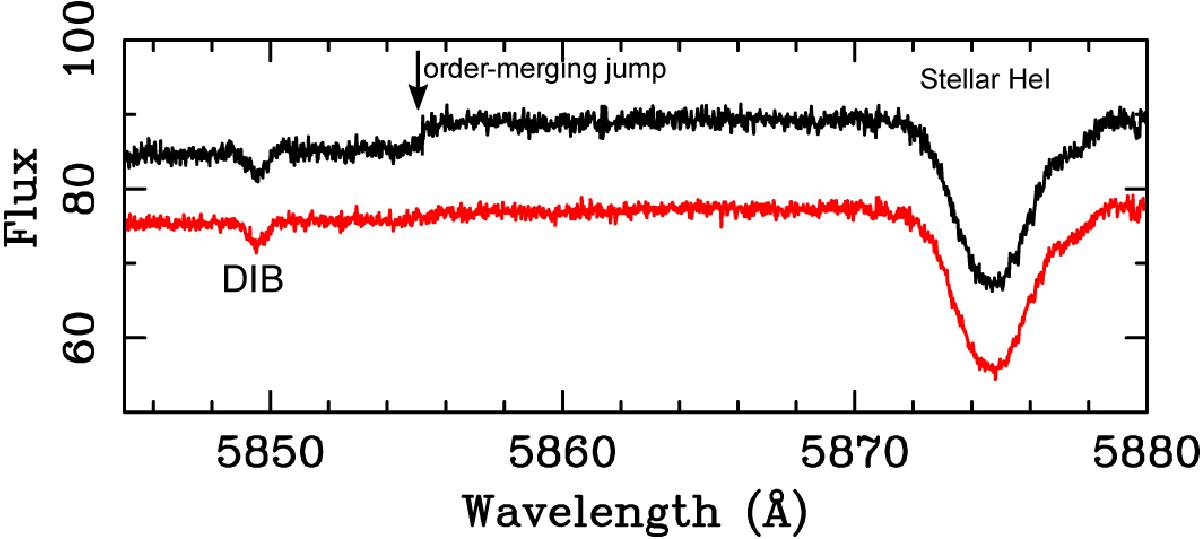
Close-up view of a region including two overlapping orders in the 564-nm setting for HD 23180 for both reduction “A” (bottom red trace) and reduction “B” (top black trace). The small jump in the continuum at approximately 5855 Å seen in reduction B (top black trace) is due to imperfect merging of two echelle orders. The apparent difference in S/N is due to alternative choices of wavelength sampling.
Current usage metrics show cumulative count of Article Views (full-text article views including HTML views, PDF and ePub downloads, according to the available data) and Abstracts Views on Vision4Press platform.
Data correspond to usage on the plateform after 2015. The current usage metrics is available 48-96 hours after online publication and is updated daily on week days.
Initial download of the metrics may take a while.