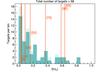
Fig. 2
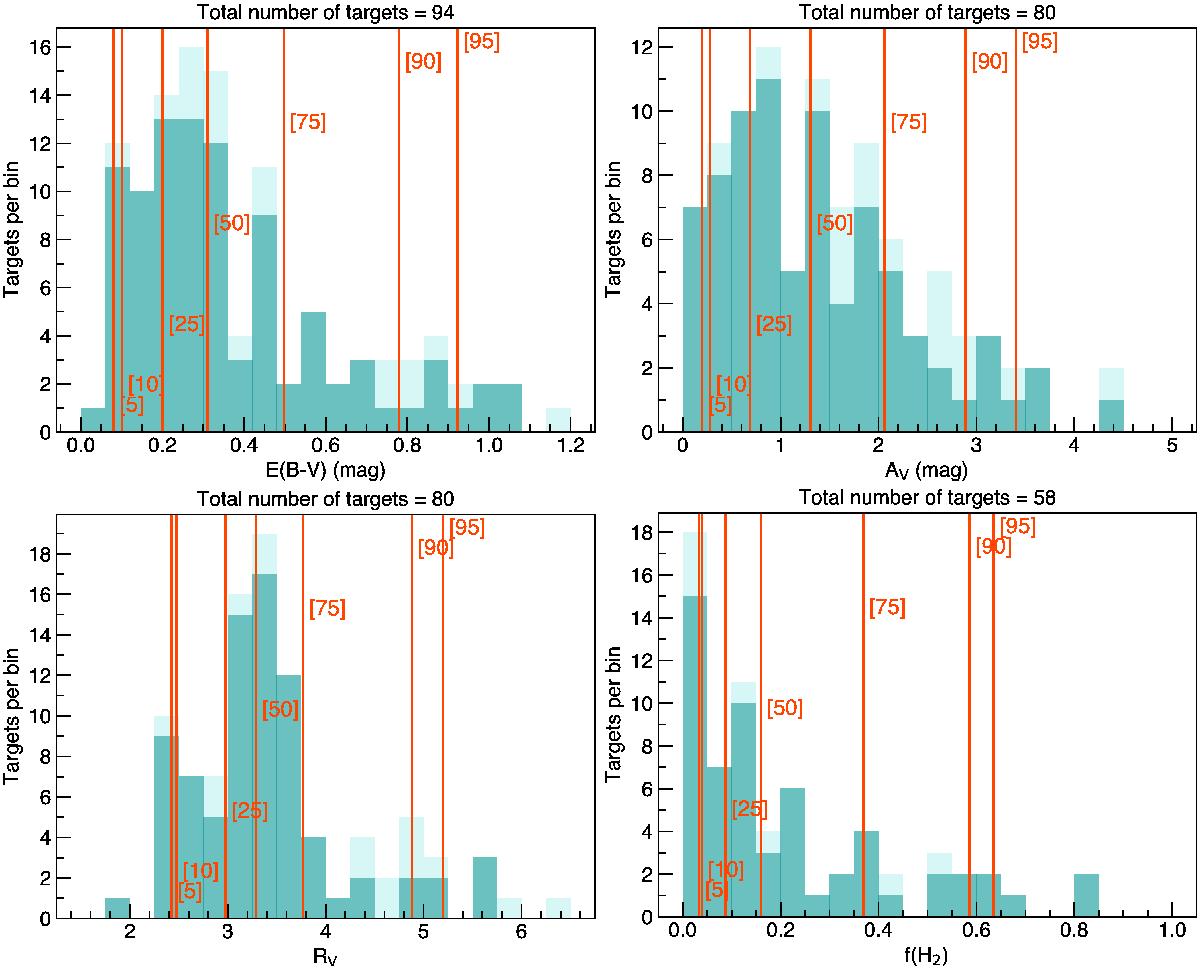
Number of selected targets as function of reddening E(B−V), extinction AV, the ratio of total-to-selective extinction RV (=AV/E(B−V)), and the fraction of molecular hydrogen fH2for the target sample. The number of observed targets with reported values for each quantity are given at the top of each panel. The dark blue and light blue distributions correspond to the samples of observed and observed + foreseen targets. The vertical red lines indicate the value of the 5, 10, 25, 50, 75, 90, and 95 percentiles of each sample. The labels are located such that they trace the cumulative target distribution.
Current usage metrics show cumulative count of Article Views (full-text article views including HTML views, PDF and ePub downloads, according to the available data) and Abstracts Views on Vision4Press platform.
Data correspond to usage on the plateform after 2015. The current usage metrics is available 48-96 hours after online publication and is updated daily on week days.
Initial download of the metrics may take a while.