Fig. B.1
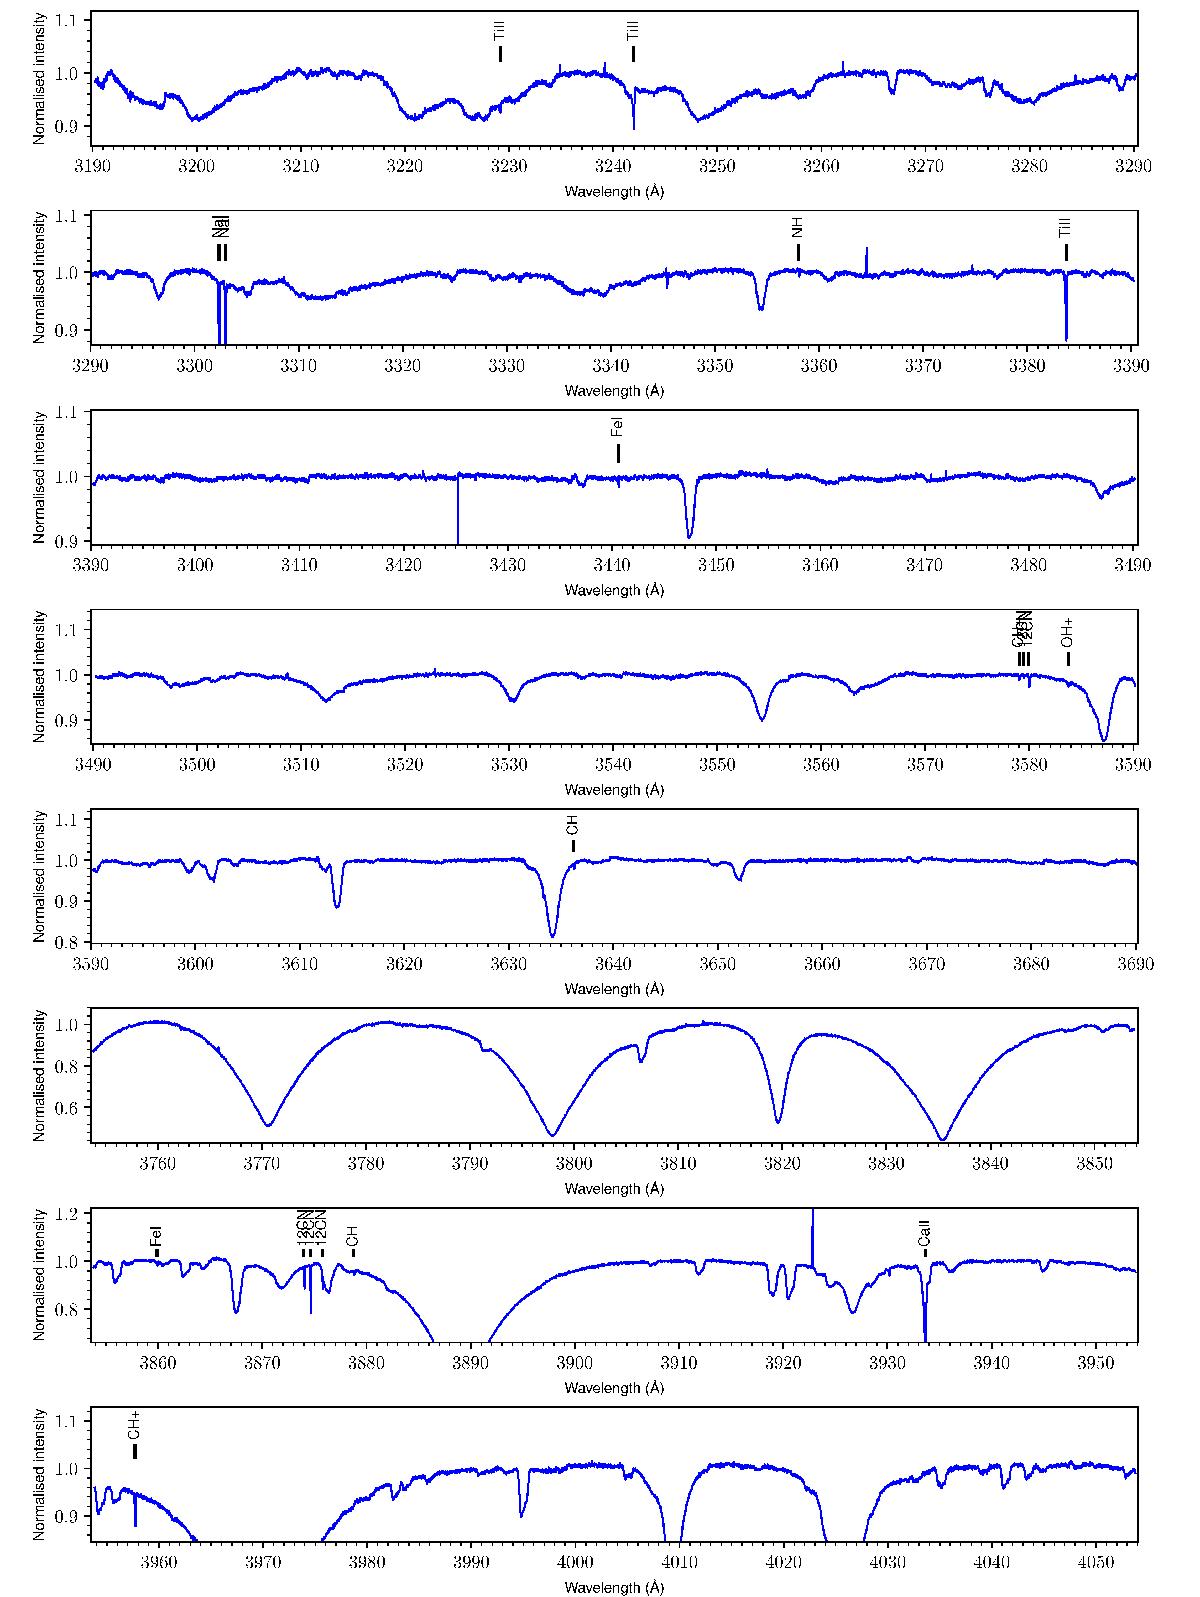
EDIBLES spectrum for HD 170740 (solid blue). The preliminary normalisation shown here is from spline fits to broad regions of each UVES settings, and order-merging residuals can also be seen – future quantitative analysis will employ tailored, local rectifications of the data. Electronic transitions of interstellar atomic and di-atomic species are labeled. Above 4000 Å a generic model of the telluric transmission spectrum (retrieved from the ESO Sky Calculator) is shown in yellow/orange as well as the Jenniskens & Désert (1994) average ISM DIB spectrum (scaled to E(B−V) = 0.5 mag) in solid green.
Current usage metrics show cumulative count of Article Views (full-text article views including HTML views, PDF and ePub downloads, according to the available data) and Abstracts Views on Vision4Press platform.
Data correspond to usage on the plateform after 2015. The current usage metrics is available 48-96 hours after online publication and is updated daily on week days.
Initial download of the metrics may take a while.