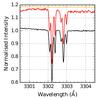
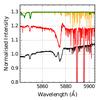
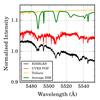
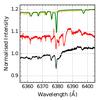
Fig. 14
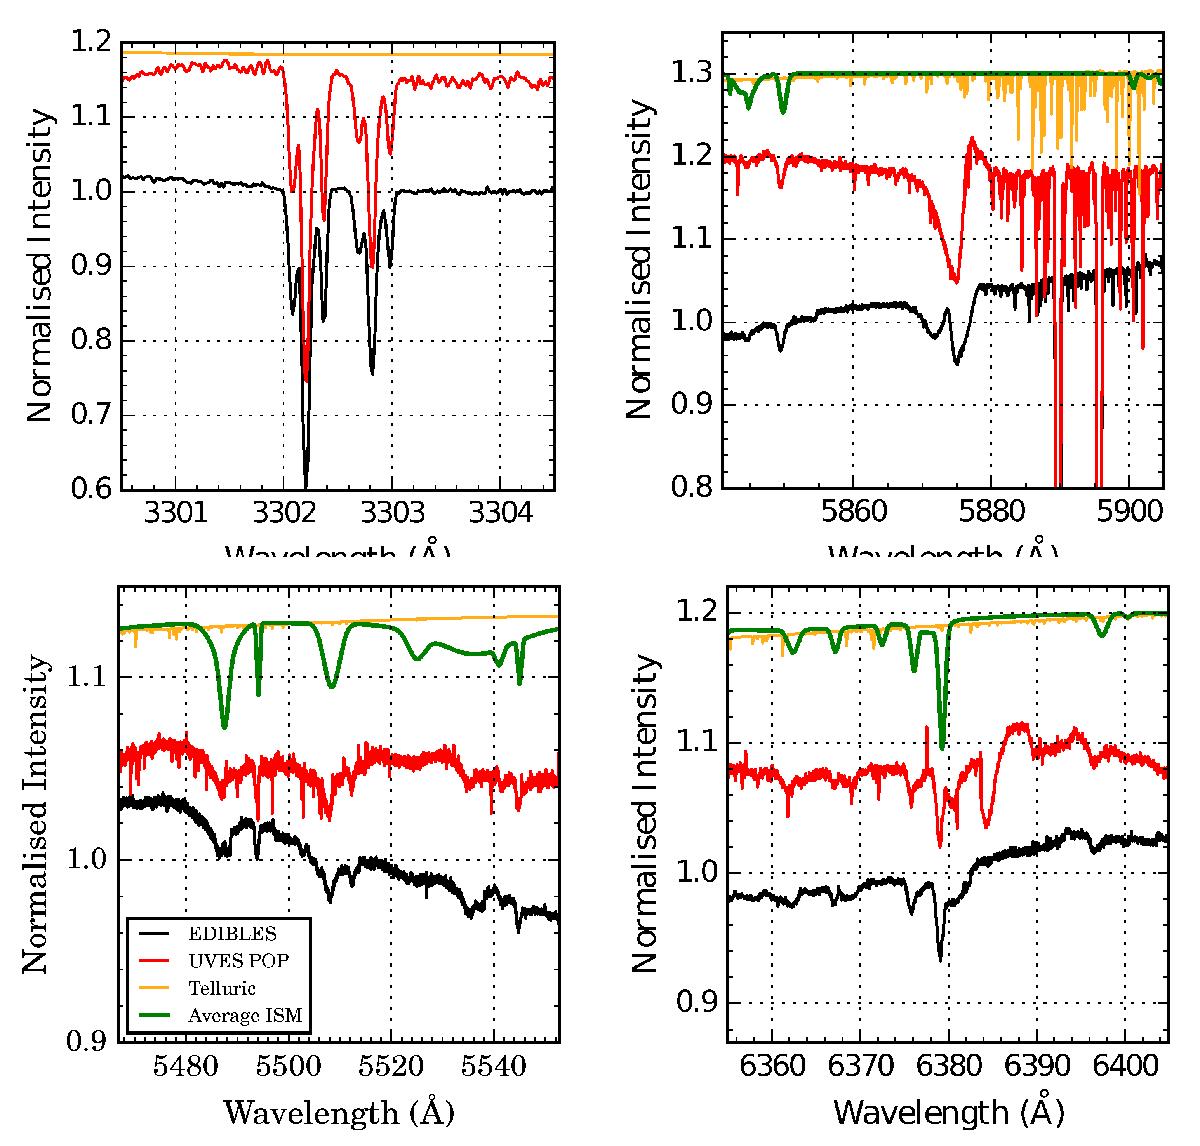
Comparison of EDIBLES (black) and UVES POP (red) spectra of HD 148937 (O6 f?p) for the interstellar Na lines (UV, top left; D, top right) and DIBs at λλ5480–5545 Å (lower left) and λλ6360–6379 Å (lower right). The telluric spectrum is shown in orange, and the average ISM DIB spectrum in green. The apparent feature at 6384 Å in the UVES POP data (bottom right panel) is related to the order merging, but the significant change in the He i 5876 line (top right panel) appears astrophysical in nature.
Current usage metrics show cumulative count of Article Views (full-text article views including HTML views, PDF and ePub downloads, according to the available data) and Abstracts Views on Vision4Press platform.
Data correspond to usage on the plateform after 2015. The current usage metrics is available 48-96 hours after online publication and is updated daily on week days.
Initial download of the metrics may take a while.