Fig. 7
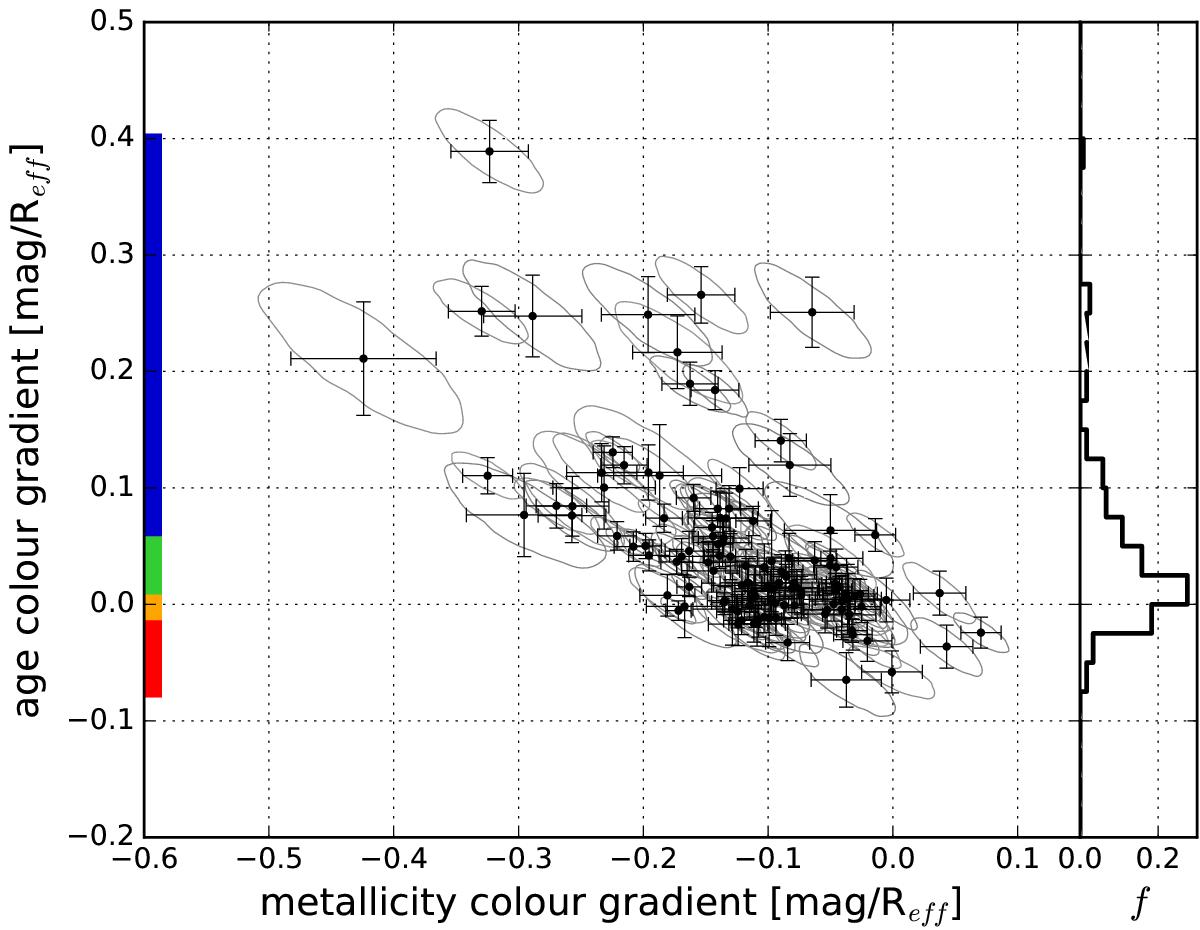
Metallicity colour gradients of our galaxies plotted against their age colour gradients (see text for definitions). The error bars denote the standard errors (see Sect. 3). The correlation of the errors is displayed by a two-dimensional 1σ Gaussian contour. The colour-coding on the y-axis defines the ranges of the four subsamples that all include the same number of galaxies (30). The fraction f of galaxies in the age colour gradient distribution is presented in the right histogram.
Current usage metrics show cumulative count of Article Views (full-text article views including HTML views, PDF and ePub downloads, according to the available data) and Abstracts Views on Vision4Press platform.
Data correspond to usage on the plateform after 2015. The current usage metrics is available 48-96 hours after online publication and is updated daily on week days.
Initial download of the metrics may take a while.