Fig. 6
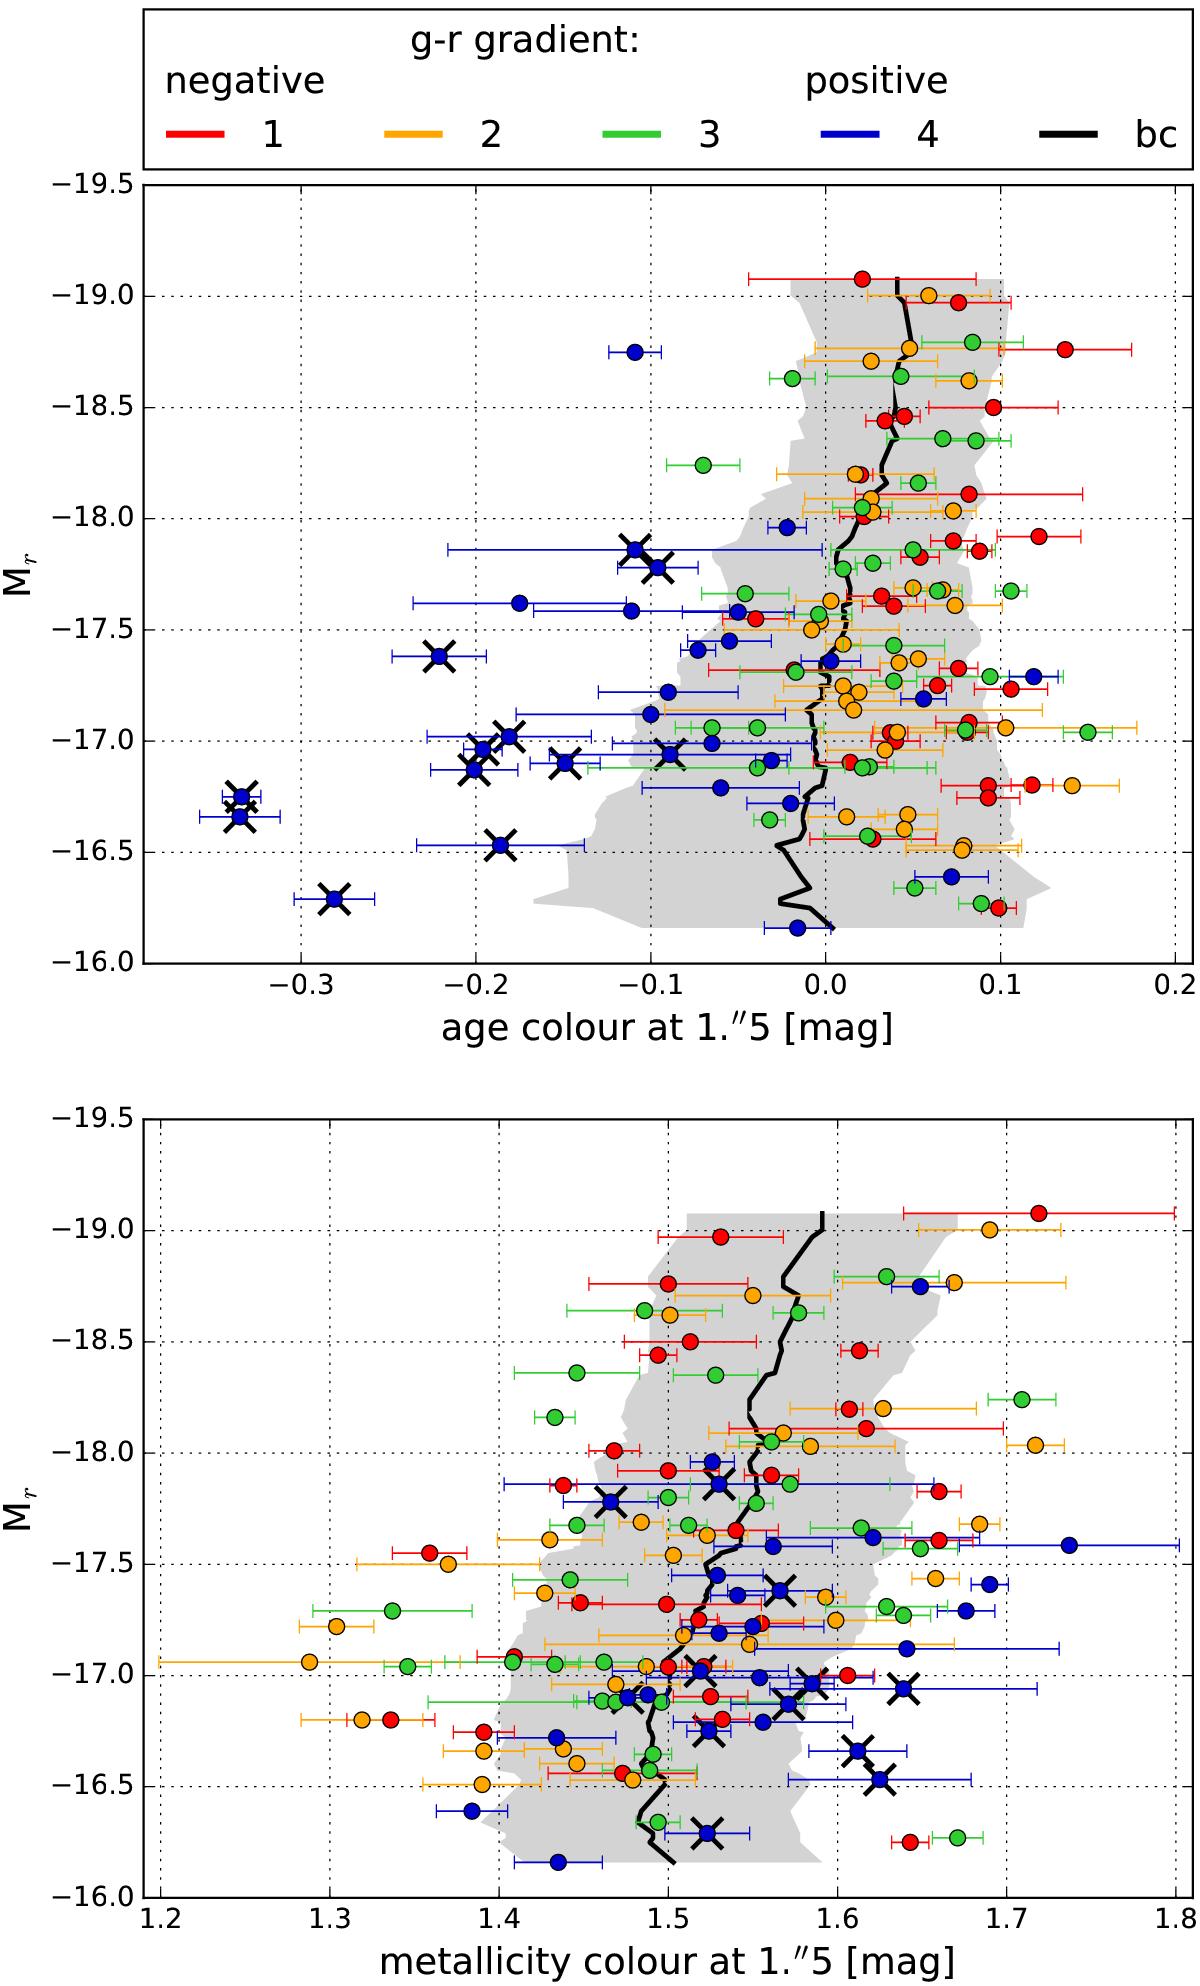
Central colour magnitude relation: age colour measured at 1.̋5 (upper panel) and metallicity colour measured at 1.̋5 (lower panel) are plotted against the absolute r-band magnitude. Error bars denote the uncertainties of the isophotal colours. Galaxies are coloured based on their g − r gradient groups (see Fig. 4). The black line describes the running mean of the colour within a 1 mag interval and the grey shaded area displays the corresponding standard deviation of the galaxies.
Current usage metrics show cumulative count of Article Views (full-text article views including HTML views, PDF and ePub downloads, according to the available data) and Abstracts Views on Vision4Press platform.
Data correspond to usage on the plateform after 2015. The current usage metrics is available 48-96 hours after online publication and is updated daily on week days.
Initial download of the metrics may take a while.