Fig. 4
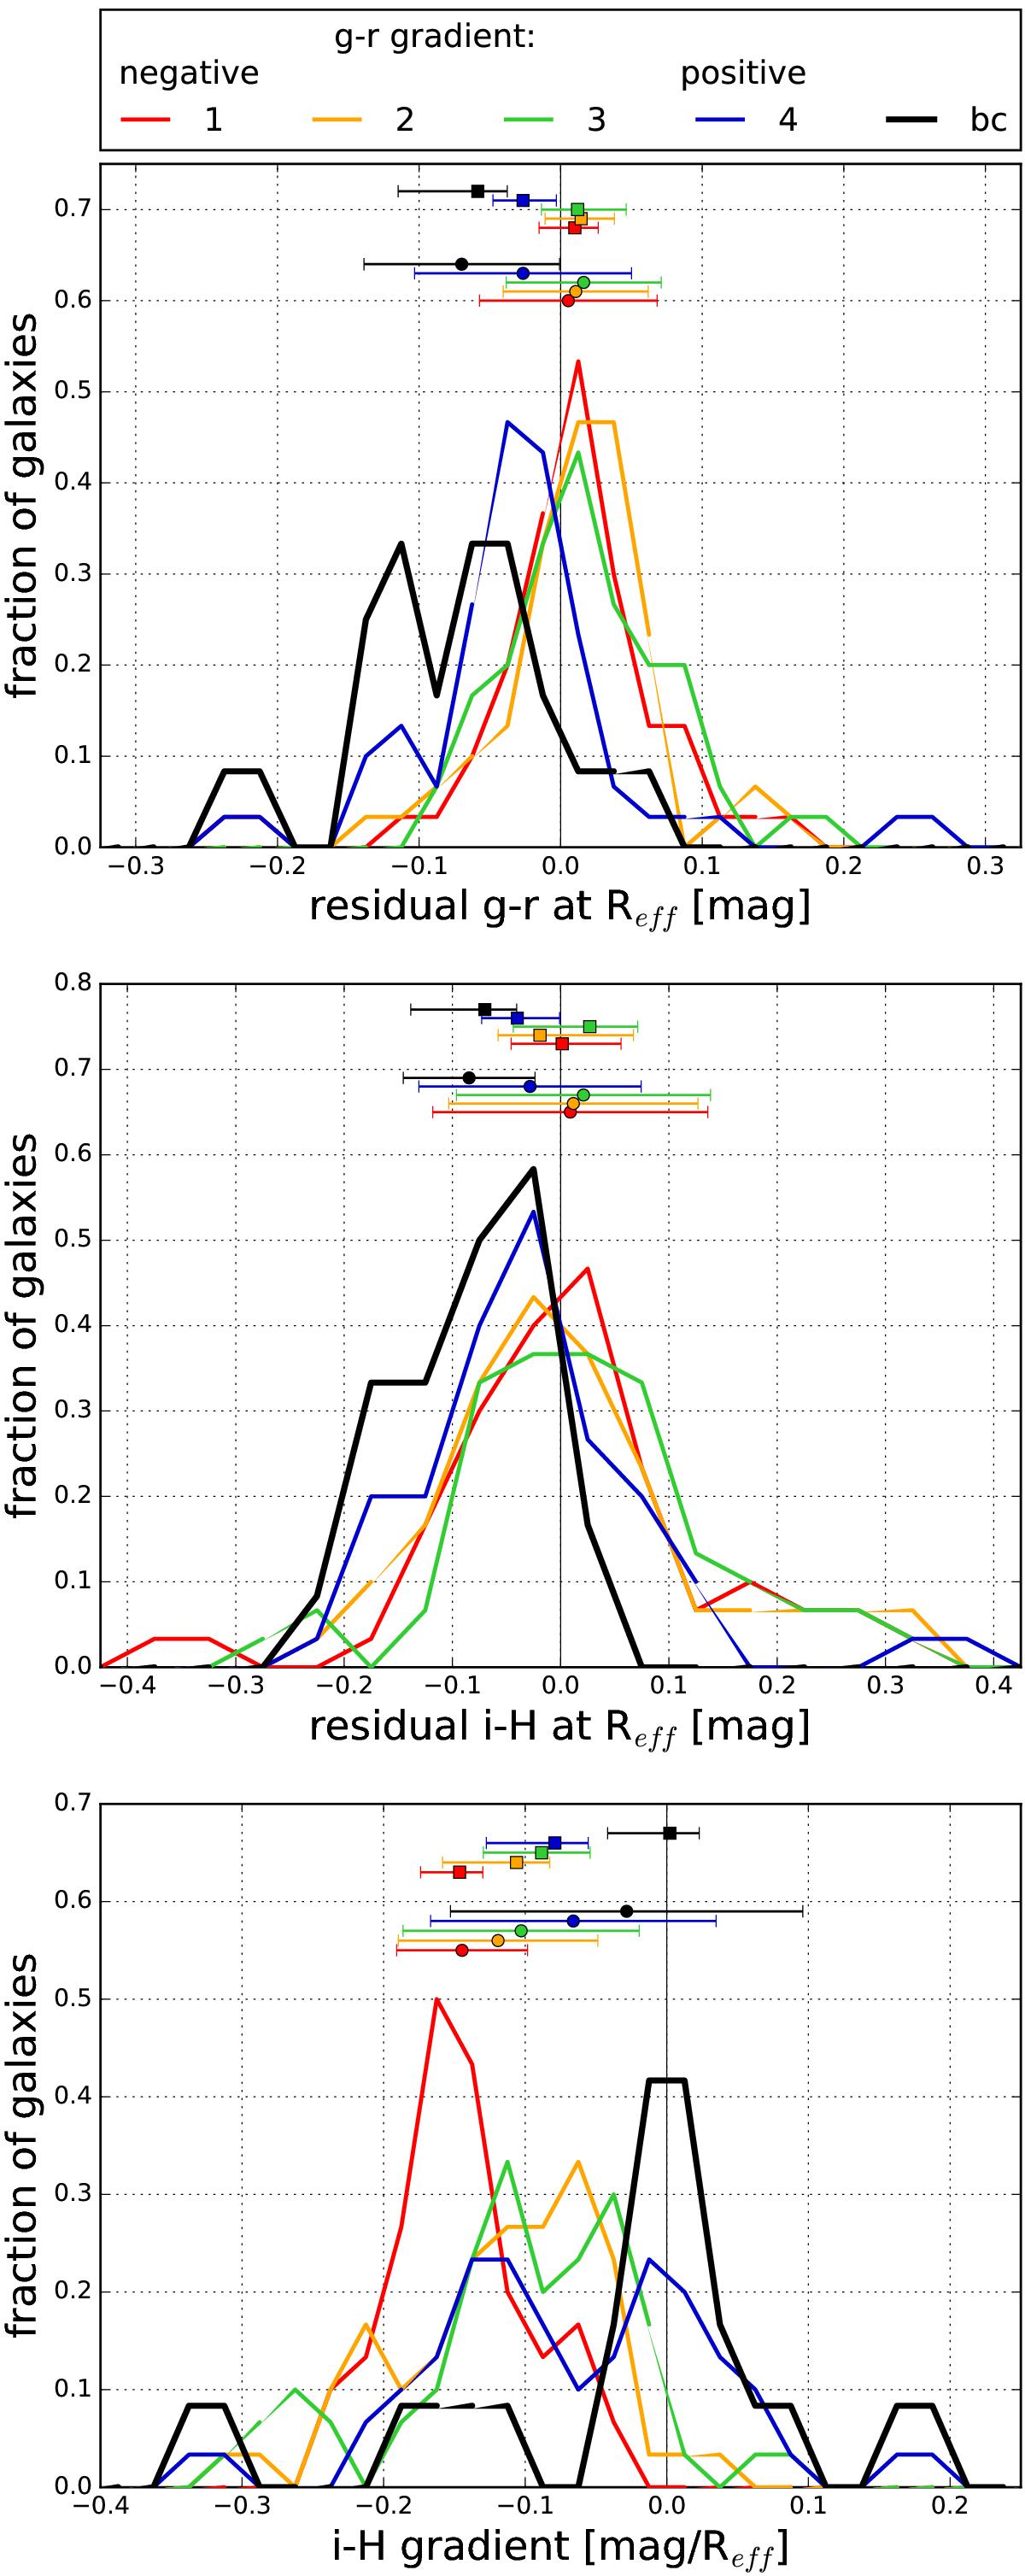
Distribution of (g − r)Reff residual colour (top), (i − H)Reff residual colour (middle), and i − H gradient (bottom), shown separately for each quartile in g − r gradient. These quartiles are 1 = [ − 0.100, − 0.032 ], 2 = [ − 0.031, − 0.007 ], 3 = [ − 0.004,0.025 ] and 4 = [ 0.028,0.384 ] in mag/Reff. In addition to the four quartiles, the blue-cored early-type dwarfs that we define in Sect. 4.1 are shown as black curve. They are also included in the highest quartile (blue curve), i.e. they enter the plot twice. Each curve is normalized to an area of 1 and is drawn by connecting points in steps of 0.05 mag along the x-axis (0.025 mag for the top panel). Each point is the normalized number of galaxies within ±0.05 mag (±0.025 mag for the top panel). The coloured circles and horizontal bars indicate the respective mean and standard deviation of the distributions, whereas the coloured squares give median and the first and third quartile of the distributions. The uncertainty of the mean value is smaller by a factor of ![]() (and by a factor of
(and by a factor of ![]() for the blue-cored galaxies) than the displayed standard deviations.
for the blue-cored galaxies) than the displayed standard deviations.
Current usage metrics show cumulative count of Article Views (full-text article views including HTML views, PDF and ePub downloads, according to the available data) and Abstracts Views on Vision4Press platform.
Data correspond to usage on the plateform after 2015. The current usage metrics is available 48-96 hours after online publication and is updated daily on week days.
Initial download of the metrics may take a while.