Fig. 3
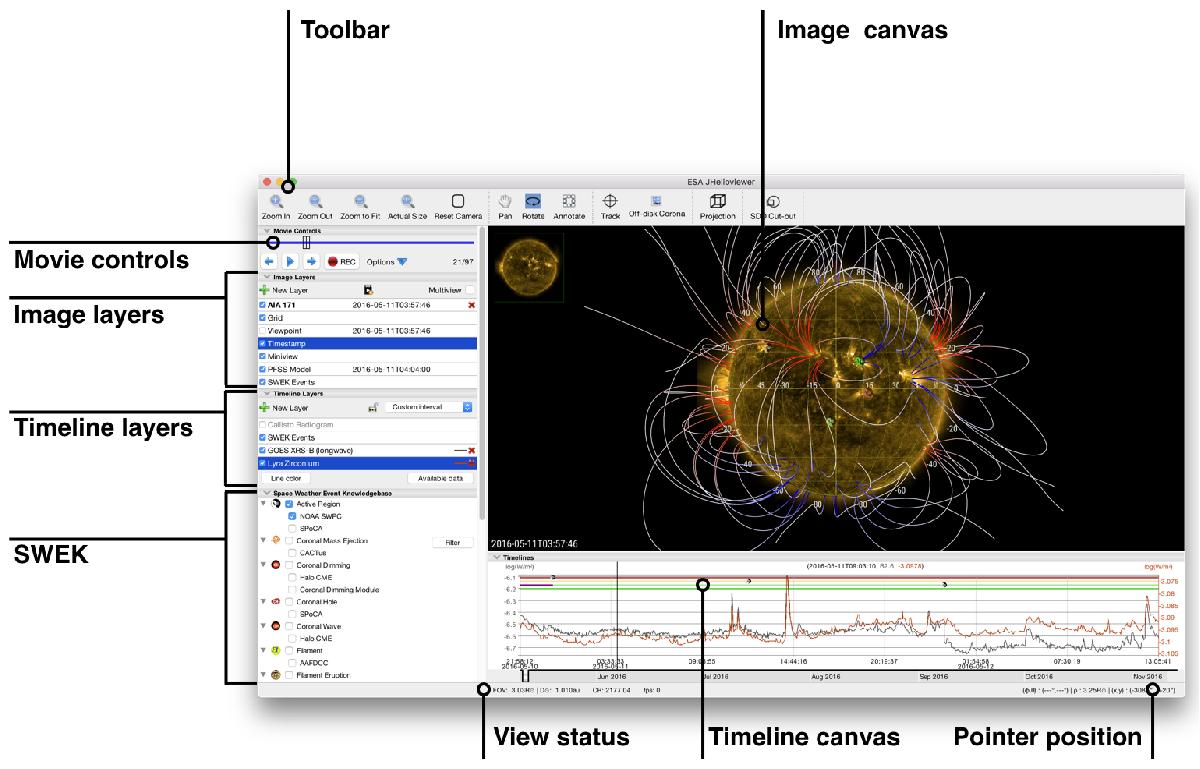
Overview of the JHelioviewer user interface. The left side hosts all display controls and layer managers for the data displayed on the right side. Image data and modelled magnetic field line are rendered on the image canvas, the main panel, while 1D and 2D time series on the timeline canvas below. Events from the Space Weather Events Knowledgebase (SWEK) can be overlaid on the image and on the timeline canvas.
Current usage metrics show cumulative count of Article Views (full-text article views including HTML views, PDF and ePub downloads, according to the available data) and Abstracts Views on Vision4Press platform.
Data correspond to usage on the plateform after 2015. The current usage metrics is available 48-96 hours after online publication and is updated daily on week days.
Initial download of the metrics may take a while.