Fig. 12
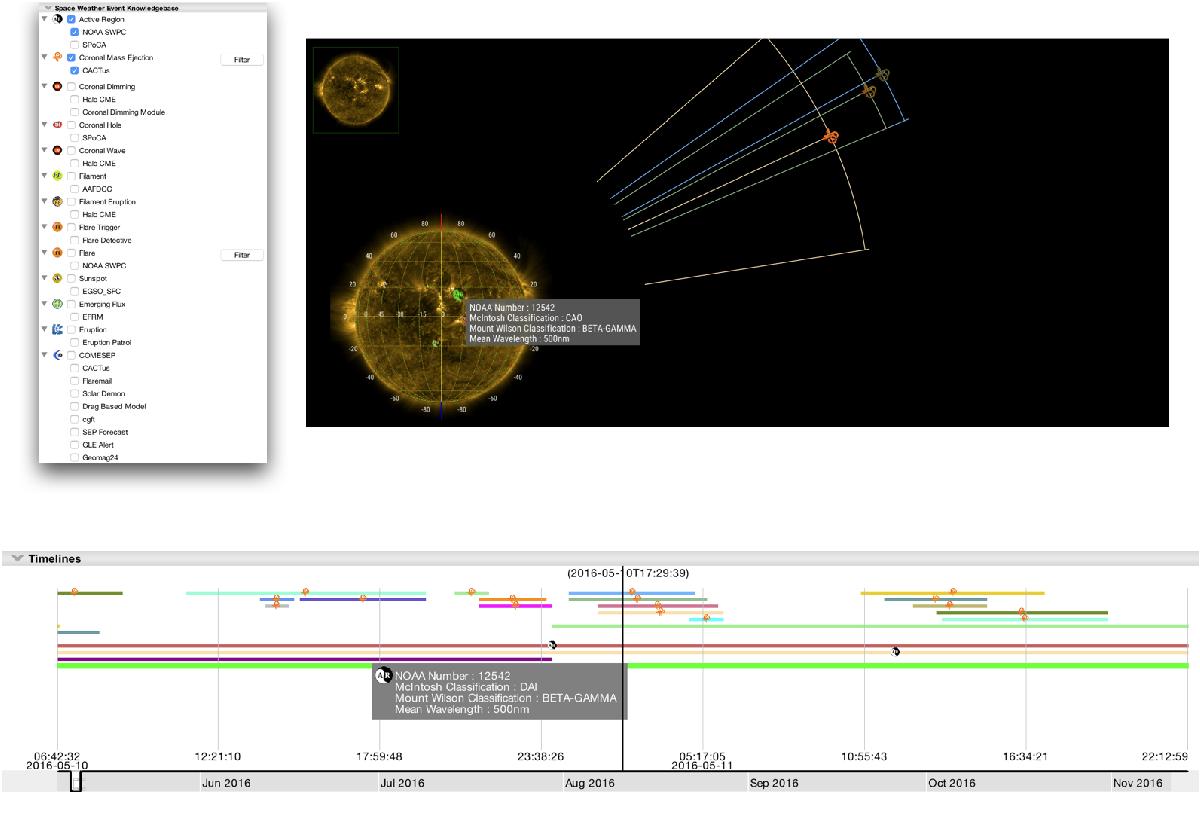
Event data display: visual markers for a large number of event types can be overlaid on the image and timeline panels. In this example, CMEs detected with CACTus and active region information from the NOAA SWPC are displayed. Spatial information like projected CME propagation is shown in the image panel, while event durations are indicated in the timeline panel.
Current usage metrics show cumulative count of Article Views (full-text article views including HTML views, PDF and ePub downloads, according to the available data) and Abstracts Views on Vision4Press platform.
Data correspond to usage on the plateform after 2015. The current usage metrics is available 48-96 hours after online publication and is updated daily on week days.
Initial download of the metrics may take a while.