Fig. 11
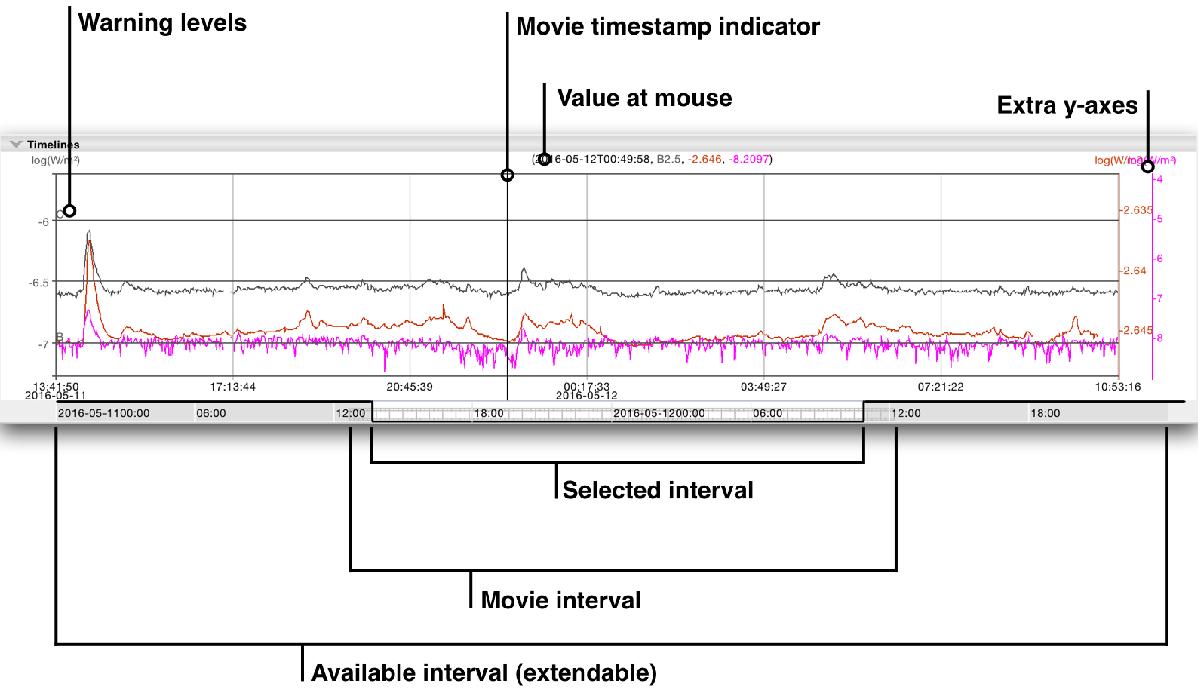
Screenshot of the JHelioviewer timeline, which can display 1D data like disk-integrated fluxes and 2D radio spectrograms. The user can zoom in time and synchronise the time ranges of timeline data and image data. The section on the bottom of the panel visualises the position in time, the movie interval, and the visible interval.
Current usage metrics show cumulative count of Article Views (full-text article views including HTML views, PDF and ePub downloads, according to the available data) and Abstracts Views on Vision4Press platform.
Data correspond to usage on the plateform after 2015. The current usage metrics is available 48-96 hours after online publication and is updated daily on week days.
Initial download of the metrics may take a while.