Fig. 1
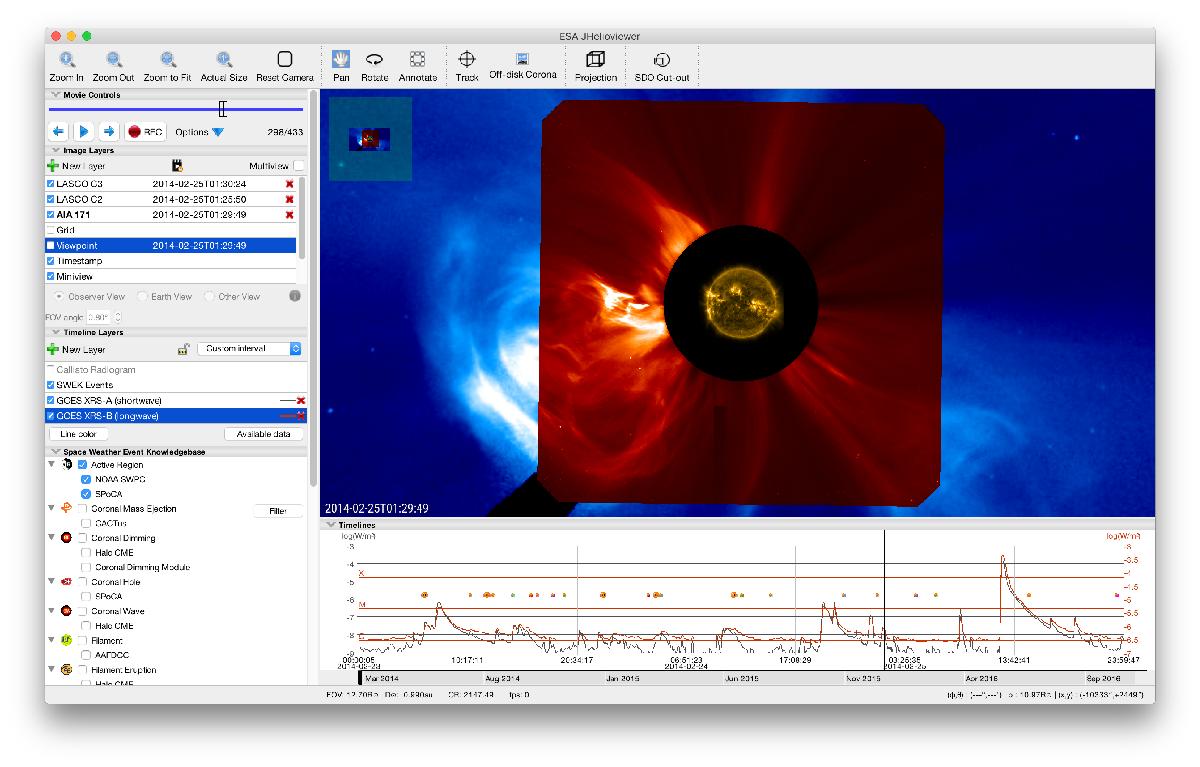
Screenshot of the JHelioviewer application. The left part of the application window hosts expandable sections to manage and display time-dependent image layers, timelines, and event data. The main panel displays image data in a 3D scene that the user can interact with. The timeline panel in the bottom right displays 1D and 2D plots of time series, e.g. disk-integrated X-ray fluxes. Markers for solar events can be overlayed on both panels.
Current usage metrics show cumulative count of Article Views (full-text article views including HTML views, PDF and ePub downloads, according to the available data) and Abstracts Views on Vision4Press platform.
Data correspond to usage on the plateform after 2015. The current usage metrics is available 48-96 hours after online publication and is updated daily on week days.
Initial download of the metrics may take a while.