Fig. 8
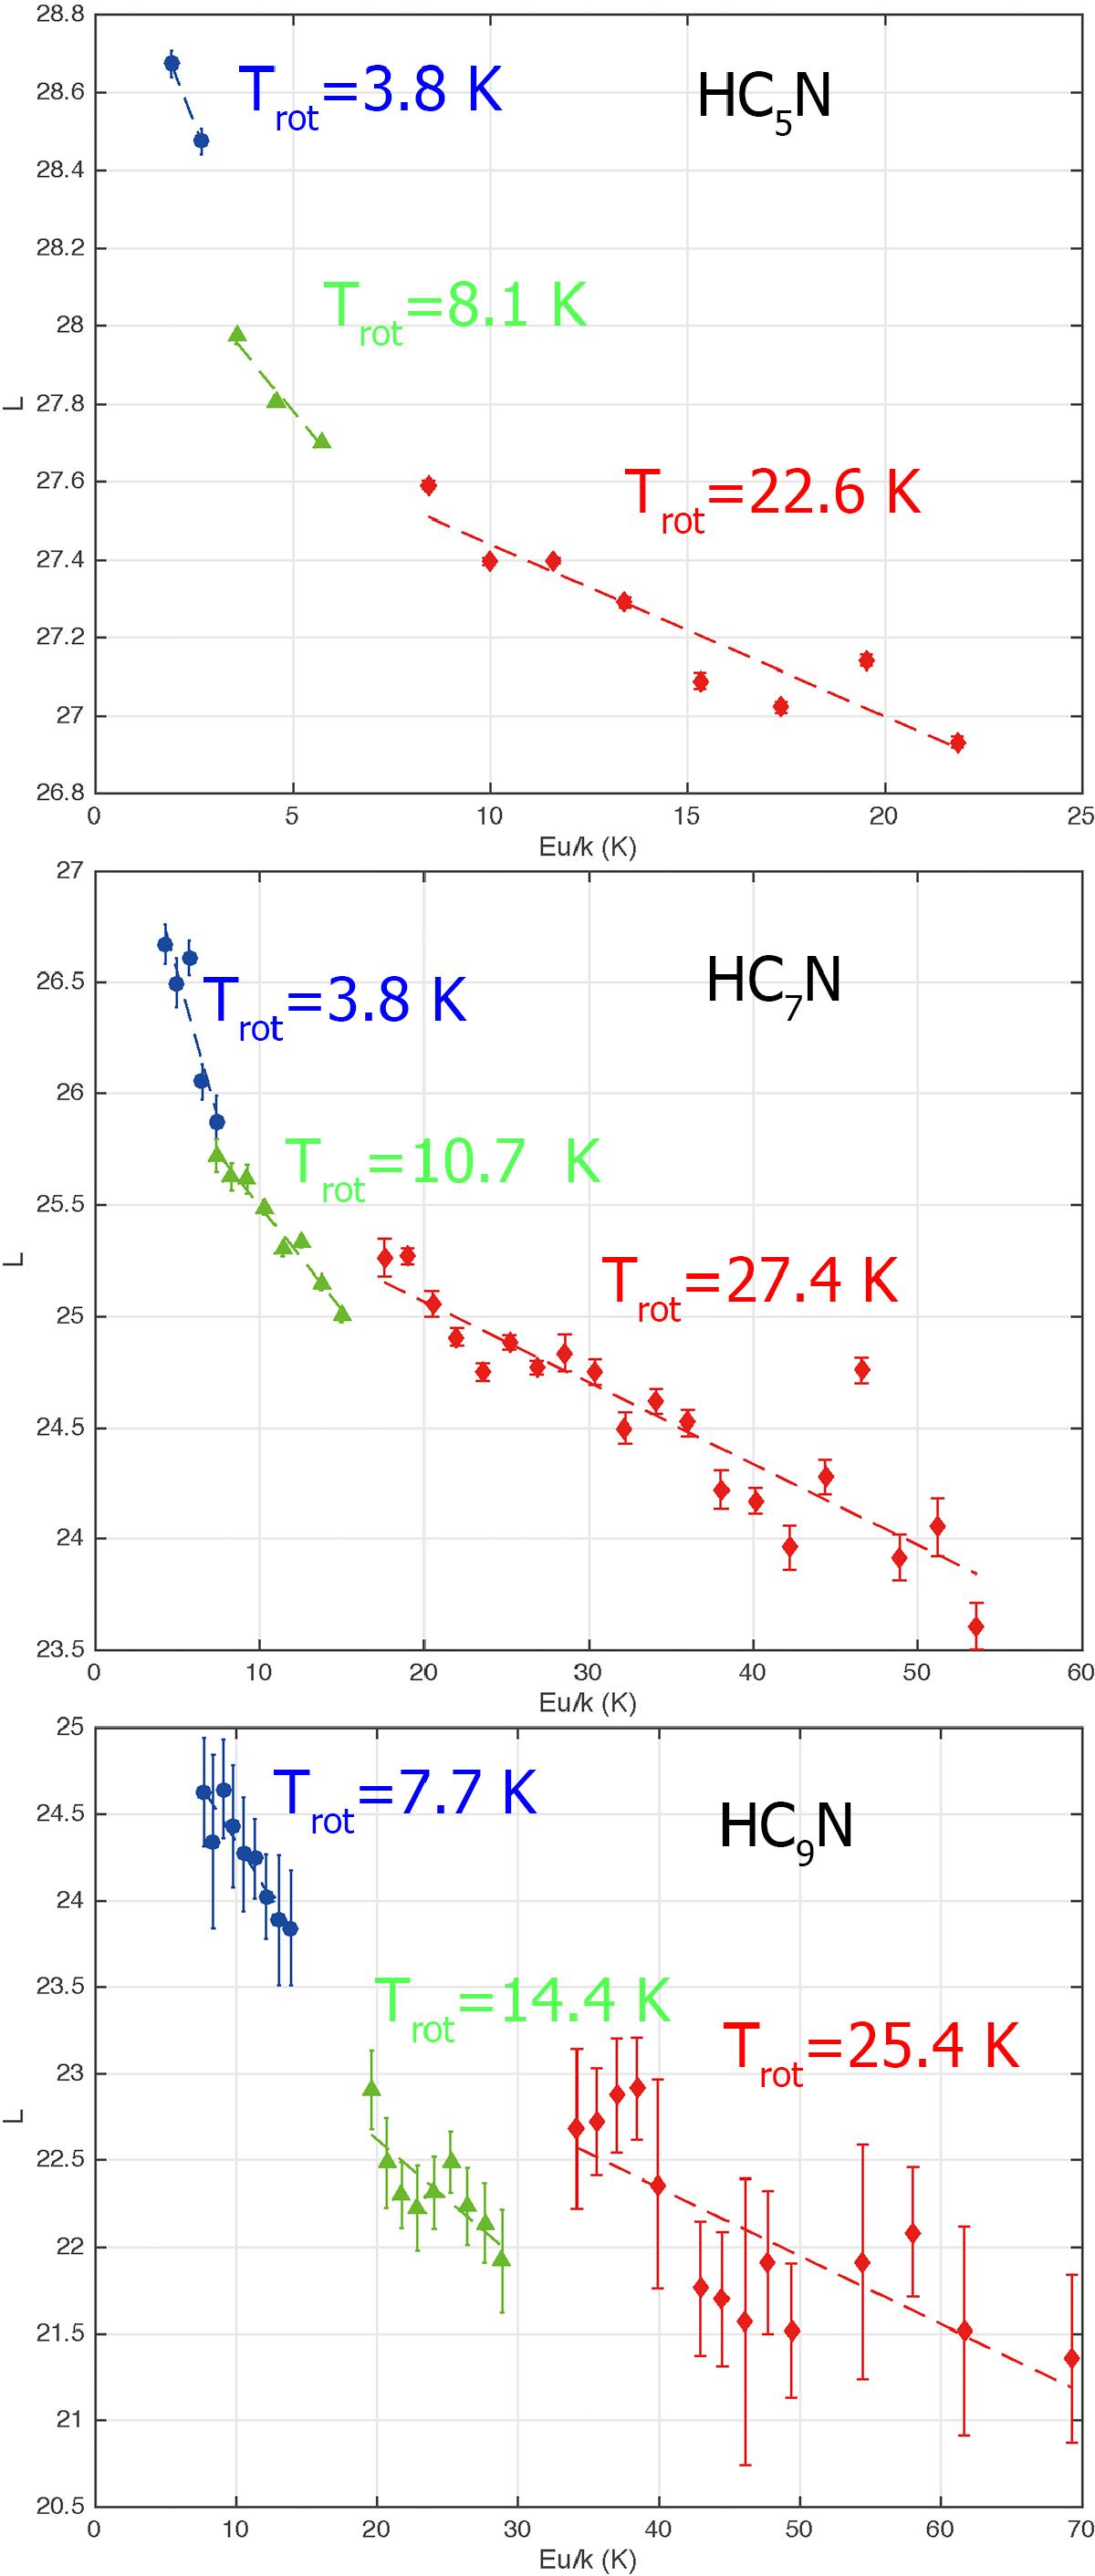
Comparison of rotational diagrams for HC5N, HC7N, and HC9N, computed separately for this and other works. The blue circles are from our TMRT-65 m observations. The green triangles are obtained from Gong et al. (2015). The red diamonds are obtained from Kawaguchi et al. (1995). The dashed lines of different colors represent linear least-squares fit to the rotational diagram accounting for data obtained from corresponding surveys.
Current usage metrics show cumulative count of Article Views (full-text article views including HTML views, PDF and ePub downloads, according to the available data) and Abstracts Views on Vision4Press platform.
Data correspond to usage on the plateform after 2015. The current usage metrics is available 48-96 hours after online publication and is updated daily on week days.
Initial download of the metrics may take a while.