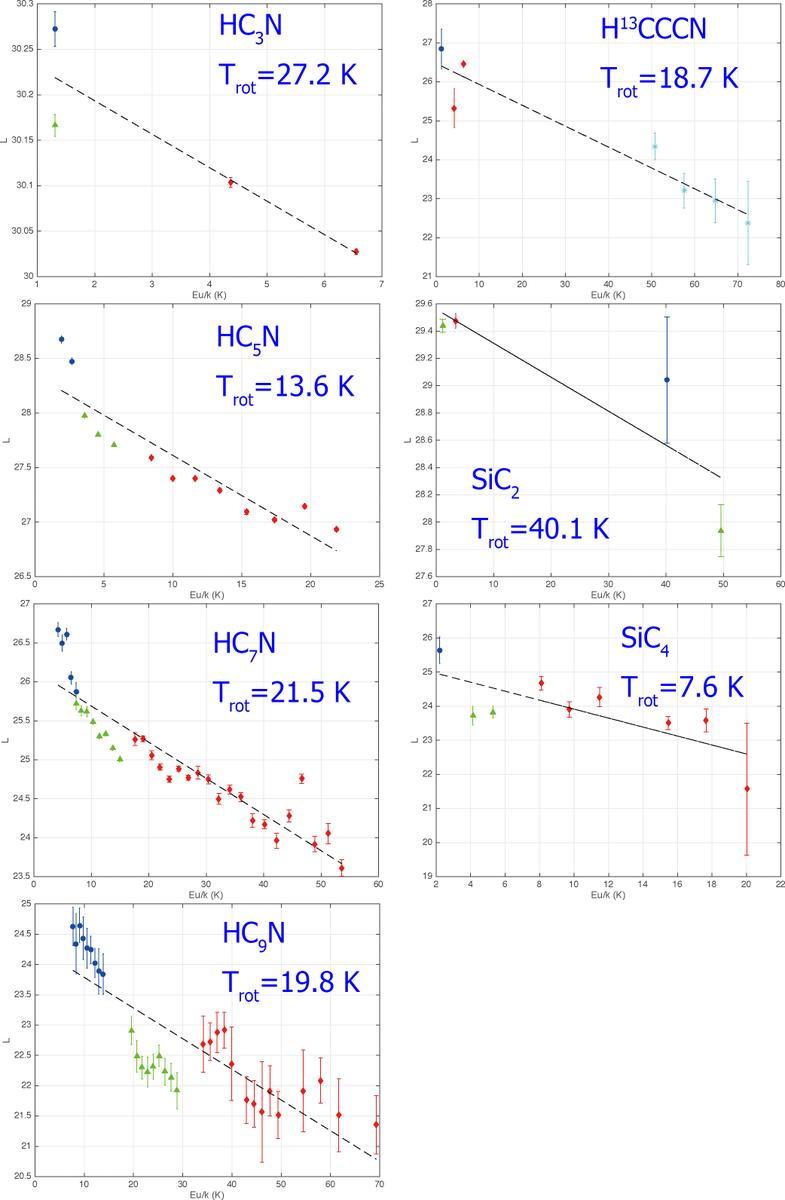
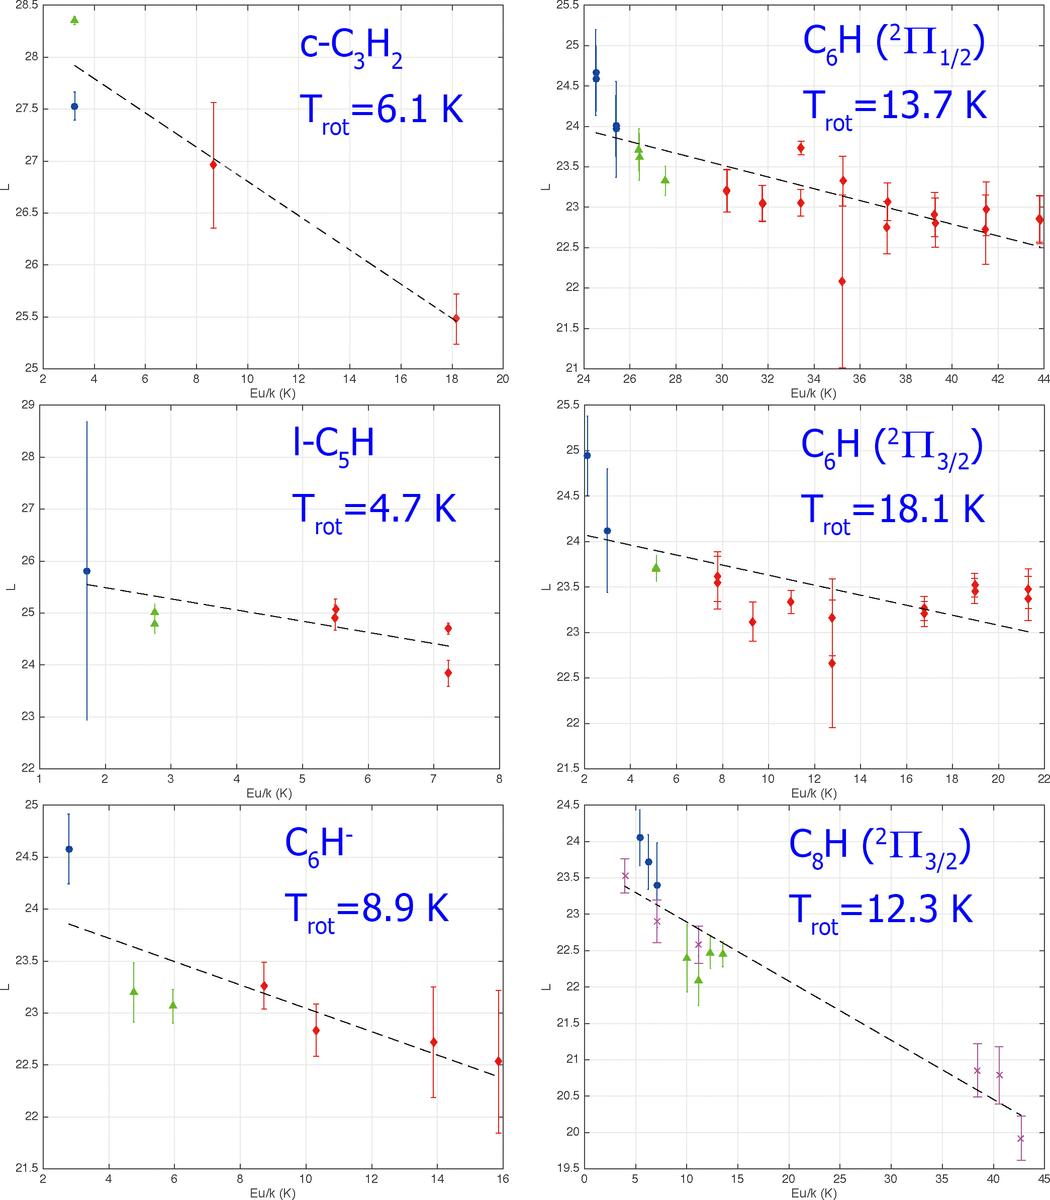
Fig. 6
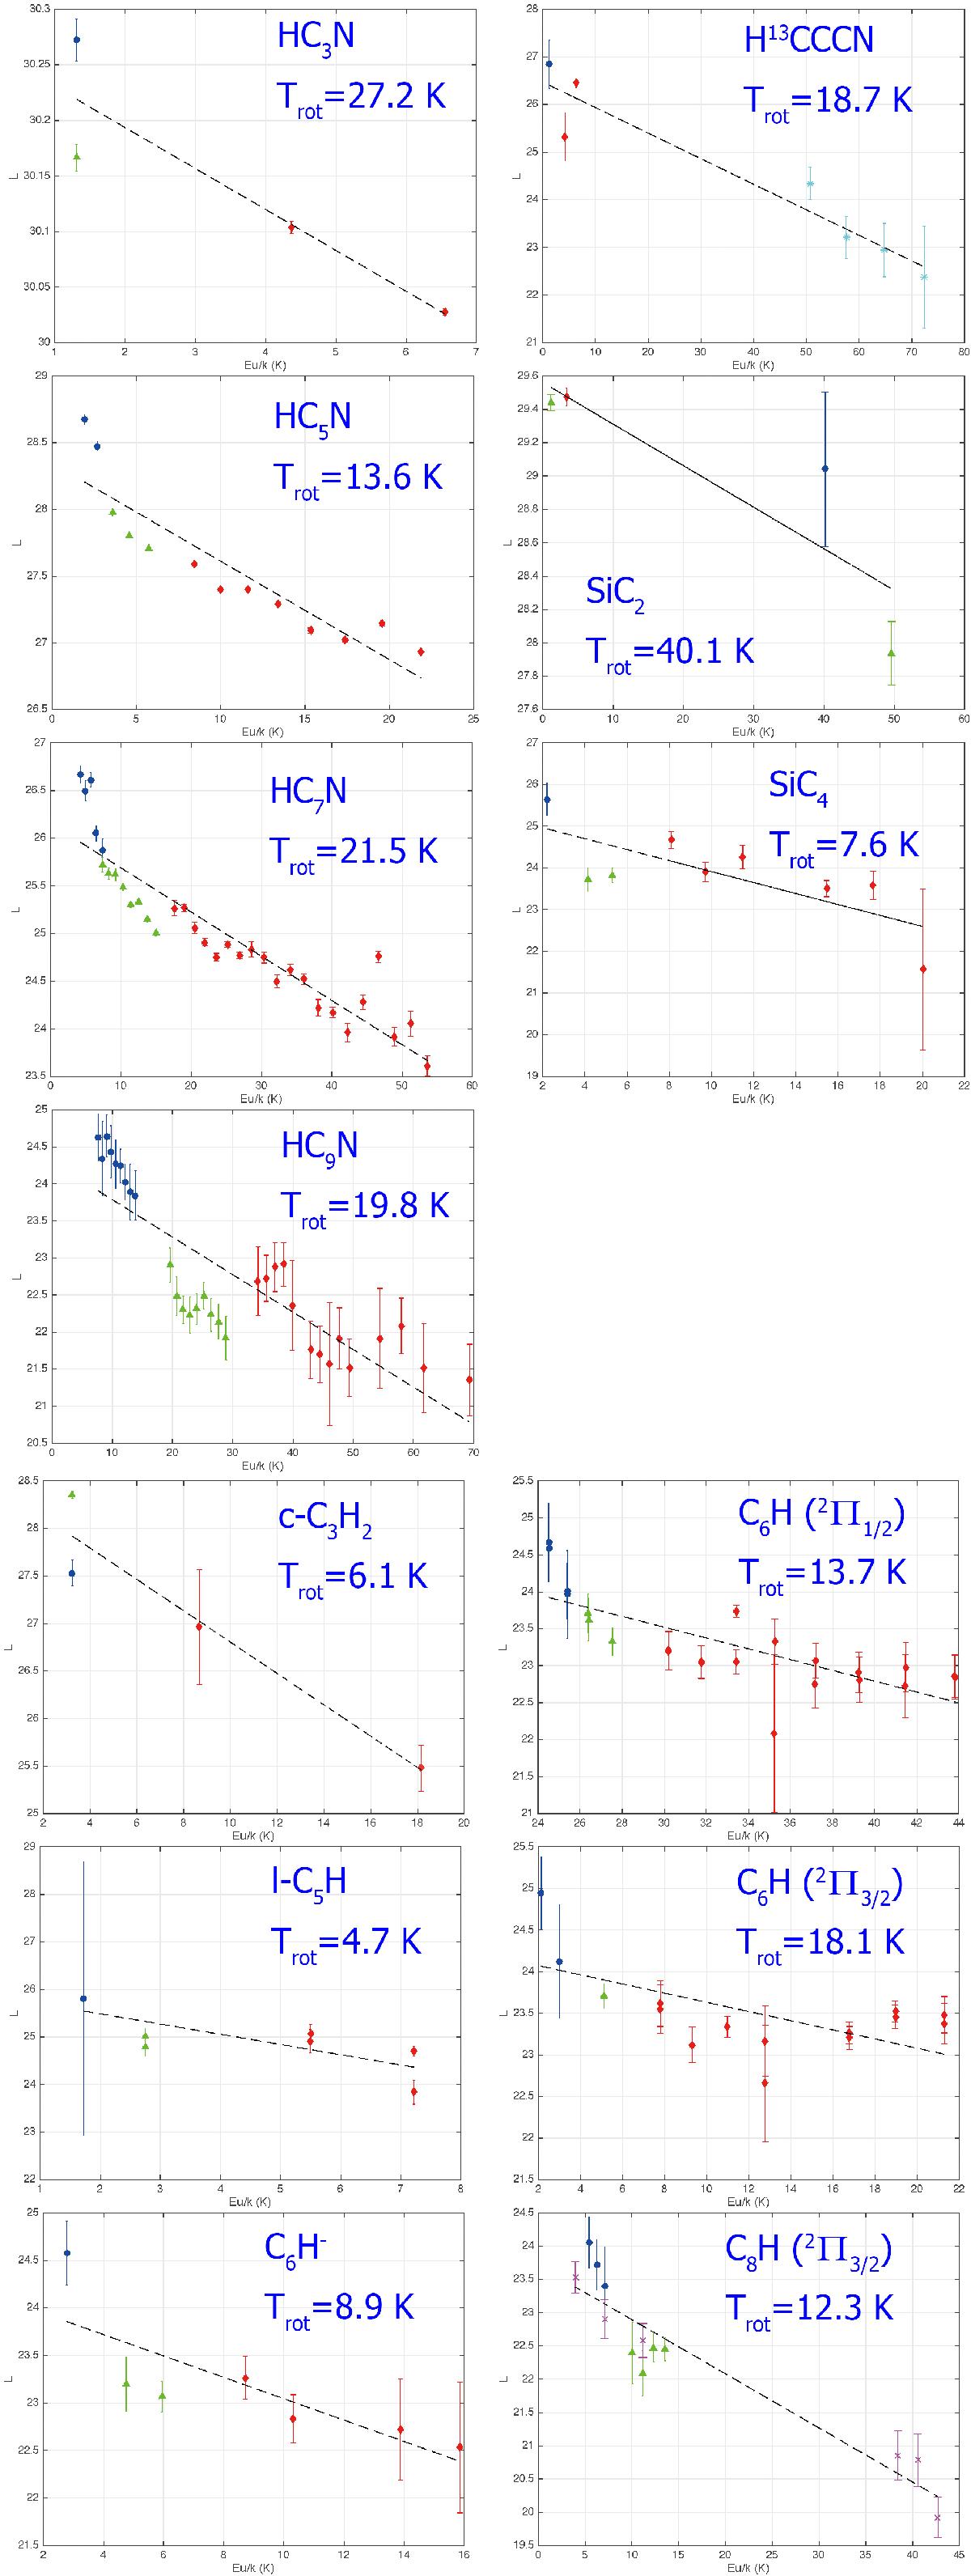
Rotational diagrams for the observed molecules in IRC +10216. The variable L denotes the left-hand side of Eq. (2). Black dashed lines represent linear least-squares fit to the rotational diagram. The blue circles are from our TMRT-65 m observations. The green triangles are obtained from Gong et al. (2015). The red diamonds are obtained from Kawaguchi et al. (1995). The magenta crosses are obtained from Remijan et al. (2007). The cyan asterisks are obtained from He et al. (2008). Their values have been corrected for beam dilution. The molecules and their corresponding rotational temperatures are given in each panel.
Current usage metrics show cumulative count of Article Views (full-text article views including HTML views, PDF and ePub downloads, according to the available data) and Abstracts Views on Vision4Press platform.
Data correspond to usage on the plateform after 2015. The current usage metrics is available 48-96 hours after online publication and is updated daily on week days.
Initial download of the metrics may take a while.