Fig. 7
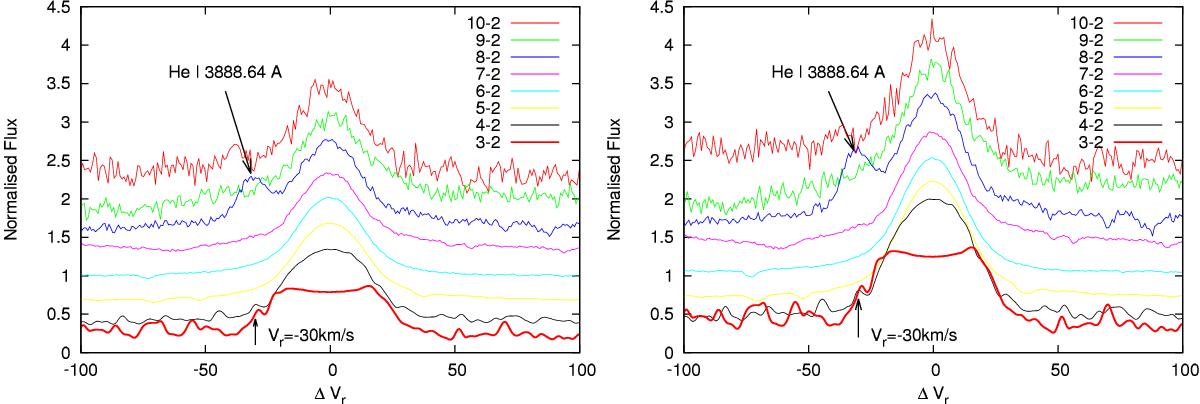
Profiles of Balmer lines shown in the flux normalised to 1.0 in the centre of lines vs. radial velocity obtained in quiet mode (left) and flare mode (right). To simplify, the plot profiles are shifted in vertical scale and Hα is shown by solid line. The arrows mark the positions of the Vr = –30 km s-1 component feature and the He I 3888.64 Å line.
Current usage metrics show cumulative count of Article Views (full-text article views including HTML views, PDF and ePub downloads, according to the available data) and Abstracts Views on Vision4Press platform.
Data correspond to usage on the plateform after 2015. The current usage metrics is available 48-96 hours after online publication and is updated daily on week days.
Initial download of the metrics may take a while.