Fig. 12
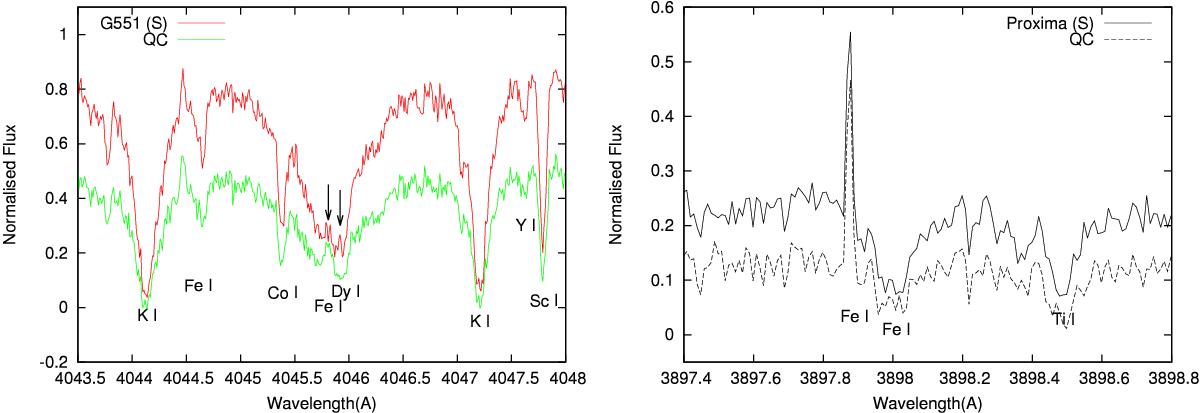
Left: absorption lines of the neutral metals with emission cores. The left arrow at 4045.81 Å marks the self-absorption in the core of the strong Fe I absorption line. In the S spectrum the strong emission detail in the core of the nearby Dy I λ 4045.97 Å line is marked by the right arrow. In the QC spectrum the detail is “eaten” by self-absorption. Self-absorption in the weak emission core of K I line at λ 4047.21 is seen as well. Right: example of iP Cyg profiles.
Current usage metrics show cumulative count of Article Views (full-text article views including HTML views, PDF and ePub downloads, according to the available data) and Abstracts Views on Vision4Press platform.
Data correspond to usage on the plateform after 2015. The current usage metrics is available 48-96 hours after online publication and is updated daily on week days.
Initial download of the metrics may take a while.