Free Access
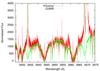
Fig. 10
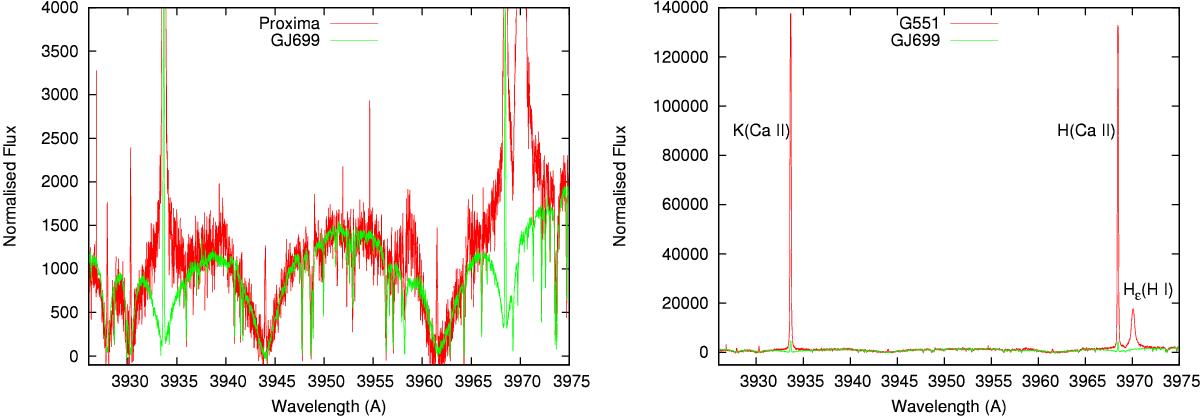
Left: emission lines in the spectral region of the Ca II H and K lines of the star Proxima and GJ 699 (see Sect. 3.3.2). Right: same plot shown over a wider wavelength range. The GJ699 spectrum shown here was downloaded from the HARPS archive.
This figure is made of several images, please see below:
Current usage metrics show cumulative count of Article Views (full-text article views including HTML views, PDF and ePub downloads, according to the available data) and Abstracts Views on Vision4Press platform.
Data correspond to usage on the plateform after 2015. The current usage metrics is available 48-96 hours after online publication and is updated daily on week days.
Initial download of the metrics may take a while.