Free Access
Fig. 1
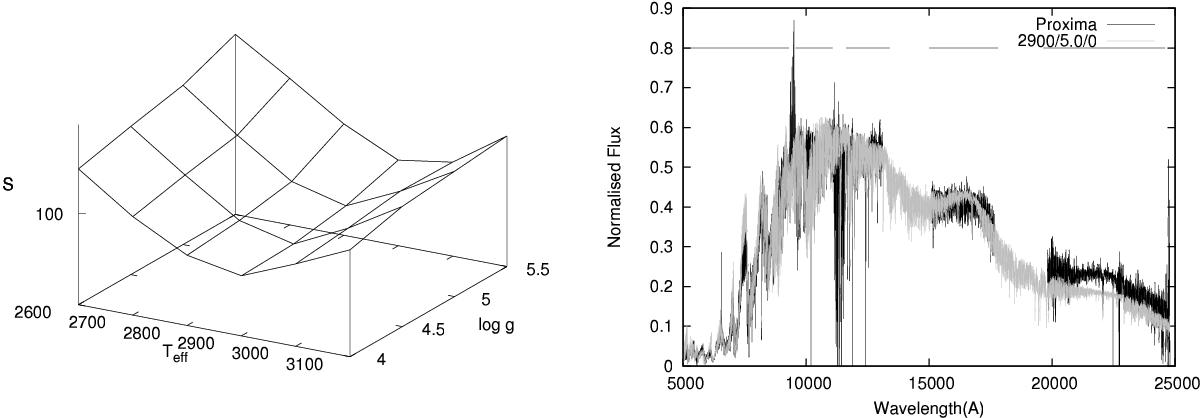
Left: dependence of S on Teff, log g. Right: best fit of synthetic spectrum 2900/5.0/0 to the observed VLT/X-shooter spectrum of Proxima. We remove here the spectral regions of the strong telluric absorption in J and K bands; spectral ranges used for the fits are indicated by horizontal lines at Fλ = 0.8.
This figure is made of several images, please see below:
Current usage metrics show cumulative count of Article Views (full-text article views including HTML views, PDF and ePub downloads, according to the available data) and Abstracts Views on Vision4Press platform.
Data correspond to usage on the plateform after 2015. The current usage metrics is available 48-96 hours after online publication and is updated daily on week days.
Initial download of the metrics may take a while.