Open Access
Fig. 4
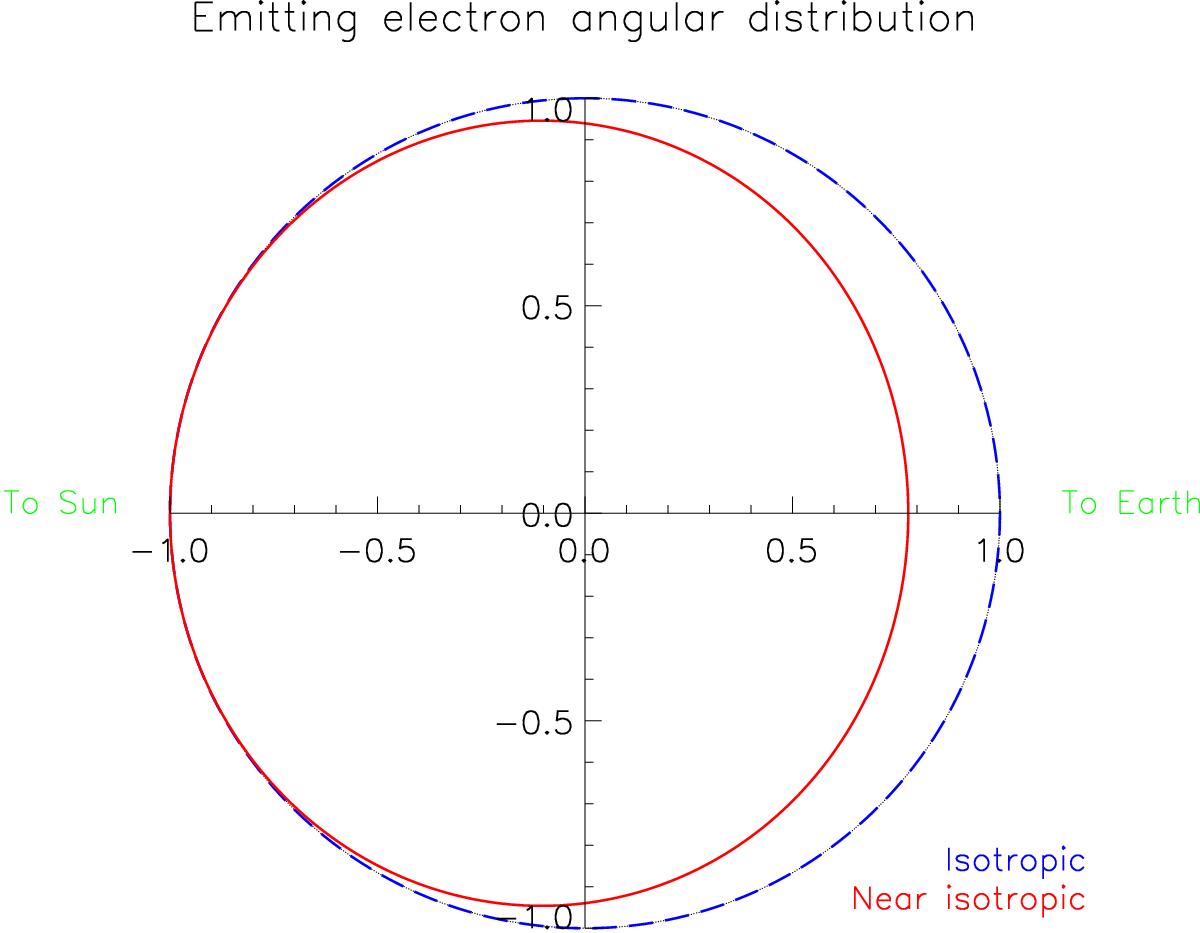
Polar plot of the simulated electron angular distributions for completely isotropic (blue) and mildly anisotropic (red). In the simple model considered here, the energy dependence of the electron anisotropy is neglected.
Current usage metrics show cumulative count of Article Views (full-text article views including HTML views, PDF and ePub downloads, according to the available data) and Abstracts Views on Vision4Press platform.
Data correspond to usage on the plateform after 2015. The current usage metrics is available 48-96 hours after online publication and is updated daily on week days.
Initial download of the metrics may take a while.