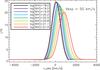
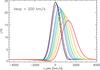
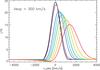
Fig. 9
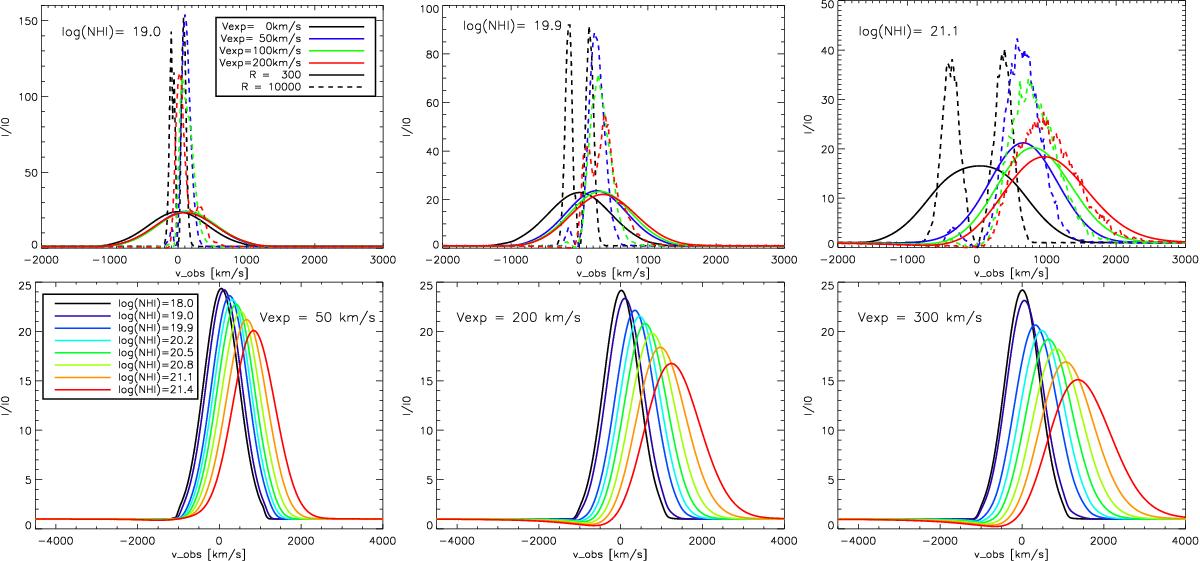
Theoretical 1D Lyα emission line (in velocity space) profiles obtained with the adopted (dust-free) shell model. The Lyα profiles (I) are normalized to the level of the continuum (I0). The maximum resolution profiles are shown as dashed lines. Solid lines correspond to VUDS resolution, R ~ 300. Upper row: we assumed different shell expansion velocities and three HI column densities, log(NHI) = 19 (leftpanel), 20 (middle panel), and 21 (right panel). Lower row: we assumed different values of HI column density and three shell expansion velocities, Vexp = 50 (left panel), 200 (middle panel), and 300 (right panel) km s-1.
Current usage metrics show cumulative count of Article Views (full-text article views including HTML views, PDF and ePub downloads, according to the available data) and Abstracts Views on Vision4Press platform.
Data correspond to usage on the plateform after 2015. The current usage metrics is available 48-96 hours after online publication and is updated daily on week days.
Initial download of the metrics may take a while.