Fig. 8
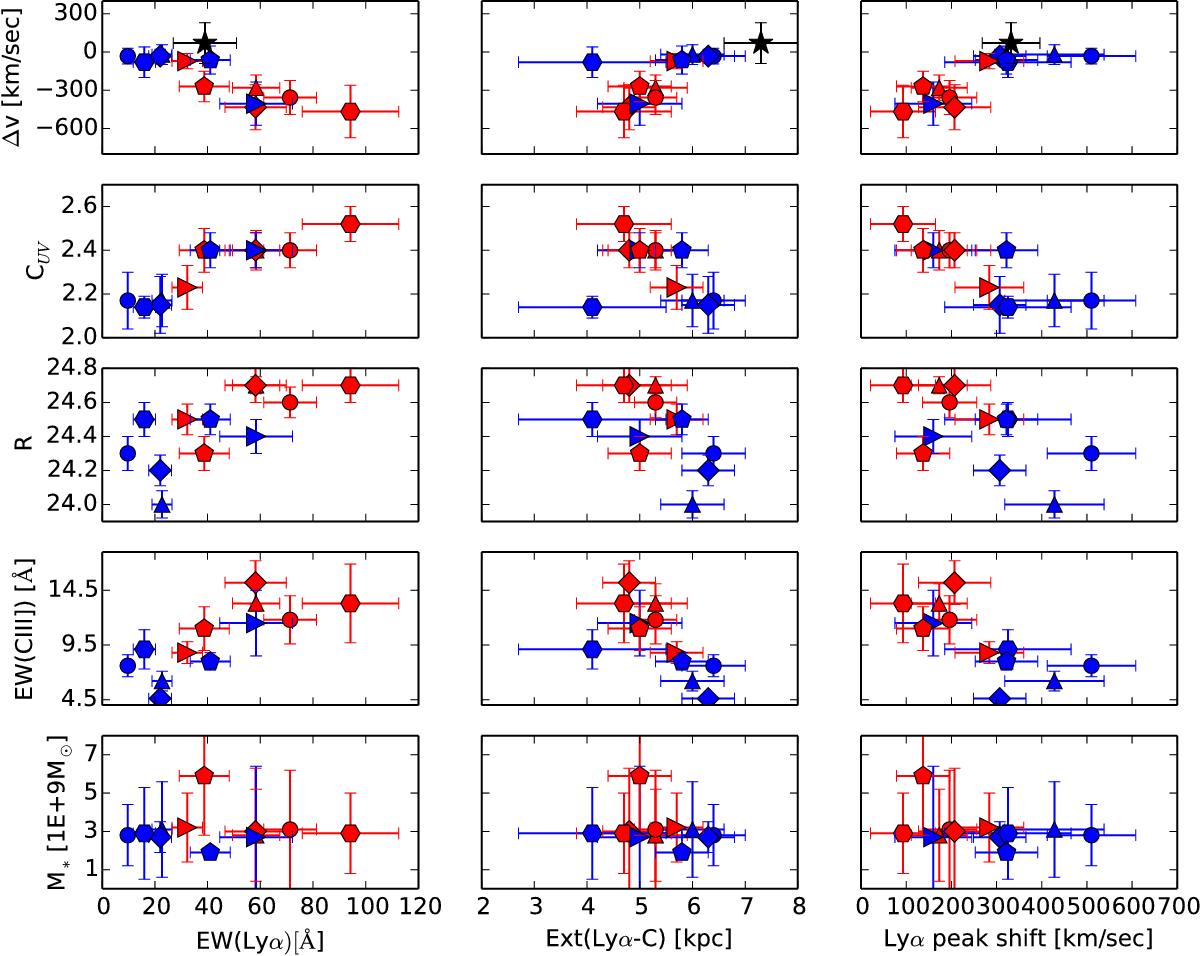
Stack physical properties vs. Lyα properties. From the top row: the plots show Δv, rest-frame UV concentration, rest-frame UV magnitude, EW(CIII]1908), and stellar mass vs. EW(Lyα) (first column), Ext(Lyα-C) (second column), and Lyα peak shift (third column). Symbols are as in Fig. 6. For each subset, Δv, EW(Lyα), EW(CIII]1908), and Lyα peak shift are measured in the stacks, while CUV, R, and M∗ correspond to the median values of the galaxies within the subset. The black star represents a subset of sources with extreme Ext(Lyα-C) in the individual spectra. These sources are characterized by moderate EW(Lyα), Lyα peak shift larger than 300 km s-1 and Δv consistent with zero.
Current usage metrics show cumulative count of Article Views (full-text article views including HTML views, PDF and ePub downloads, according to the available data) and Abstracts Views on Vision4Press platform.
Data correspond to usage on the plateform after 2015. The current usage metrics is available 48-96 hours after online publication and is updated daily on week days.
Initial download of the metrics may take a while.