Fig. 6
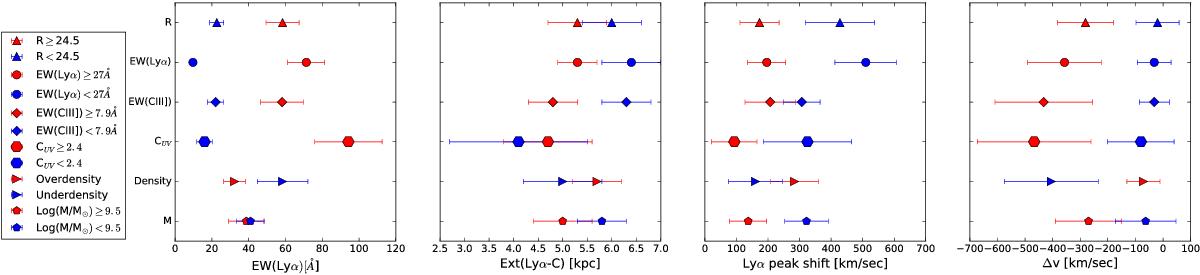
Measurements of EW(Lyα) (first panel), Ext(Lyα-C) (second panel), Lyα peak shift (third panel), and Δv (fourth panel), together with the bootstrapping (see text) error bars for the subsamples listed in Table 1. The symbols correspond to the subsets listed in Table 1: galaxies fainter(brighter) than the median R magnitude of the entire sample are shown as red(blue) triangles; galaxies characterized by EW(Lyα) larger(smaller) than the median value are shown as red(blue) filled circles; galaxies characterized by EW(CIII]1908) larger(smaller) than the median value as red(blue) diamonds; galaxies with rest-frame UV concentration larger(smaller) than the median value as red(blue) hexagons; galaxies with Ext(Lyα-C) larger(smaller) than the median value as red(blue) squares; galaxies in overdense(underdense) regions as red(blue) tilted triangles; and galaxies more(less) massive than the median value as red(blue) pentagons.
Current usage metrics show cumulative count of Article Views (full-text article views including HTML views, PDF and ePub downloads, according to the available data) and Abstracts Views on Vision4Press platform.
Data correspond to usage on the plateform after 2015. The current usage metrics is available 48-96 hours after online publication and is updated daily on week days.
Initial download of the metrics may take a while.