Fig. 5
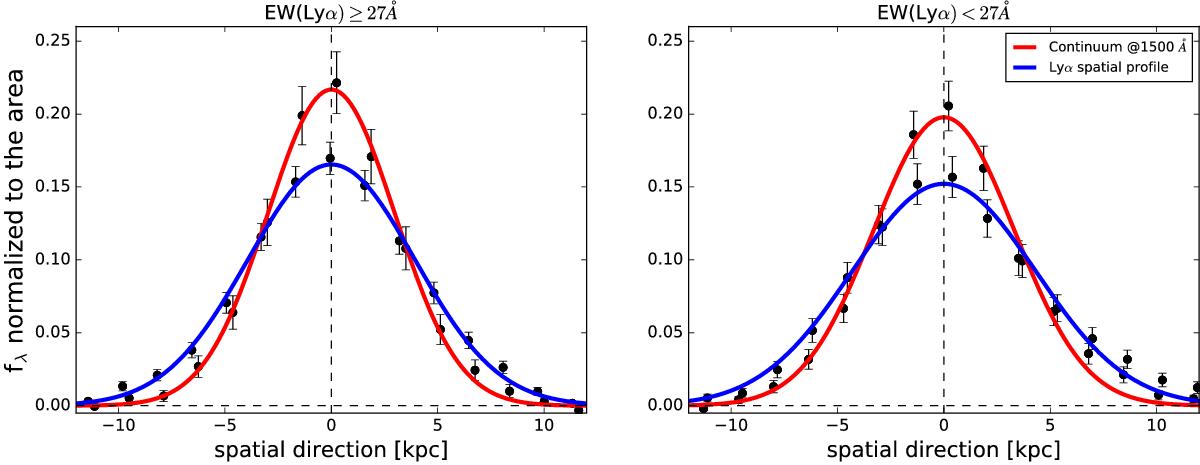
Flux density (fλ) normalized to the area below the curves of the Lyα (black dots and blue curve) and UV continuum (black dots and red curve) spatial profiles. We present the 2D-stack profiles of the subsample of the galaxies with EW(Lyα) ≥ 27 Å on the left and with EW(Lyα) < 27 Å on the right panel because this is one of the partitions leading to the strongest difference in Ext(Lyα - C). The error bars come from the background in the 2D stack at a spatial-direction position that is either higher or lower than the position of the science spectrum. The continuum is unresolved within the observation point spread function and the Lyα profile is more extended than the continuum profile.
Current usage metrics show cumulative count of Article Views (full-text article views including HTML views, PDF and ePub downloads, according to the available data) and Abstracts Views on Vision4Press platform.
Data correspond to usage on the plateform after 2015. The current usage metrics is available 48-96 hours after online publication and is updated daily on week days.
Initial download of the metrics may take a while.