Fig. 4
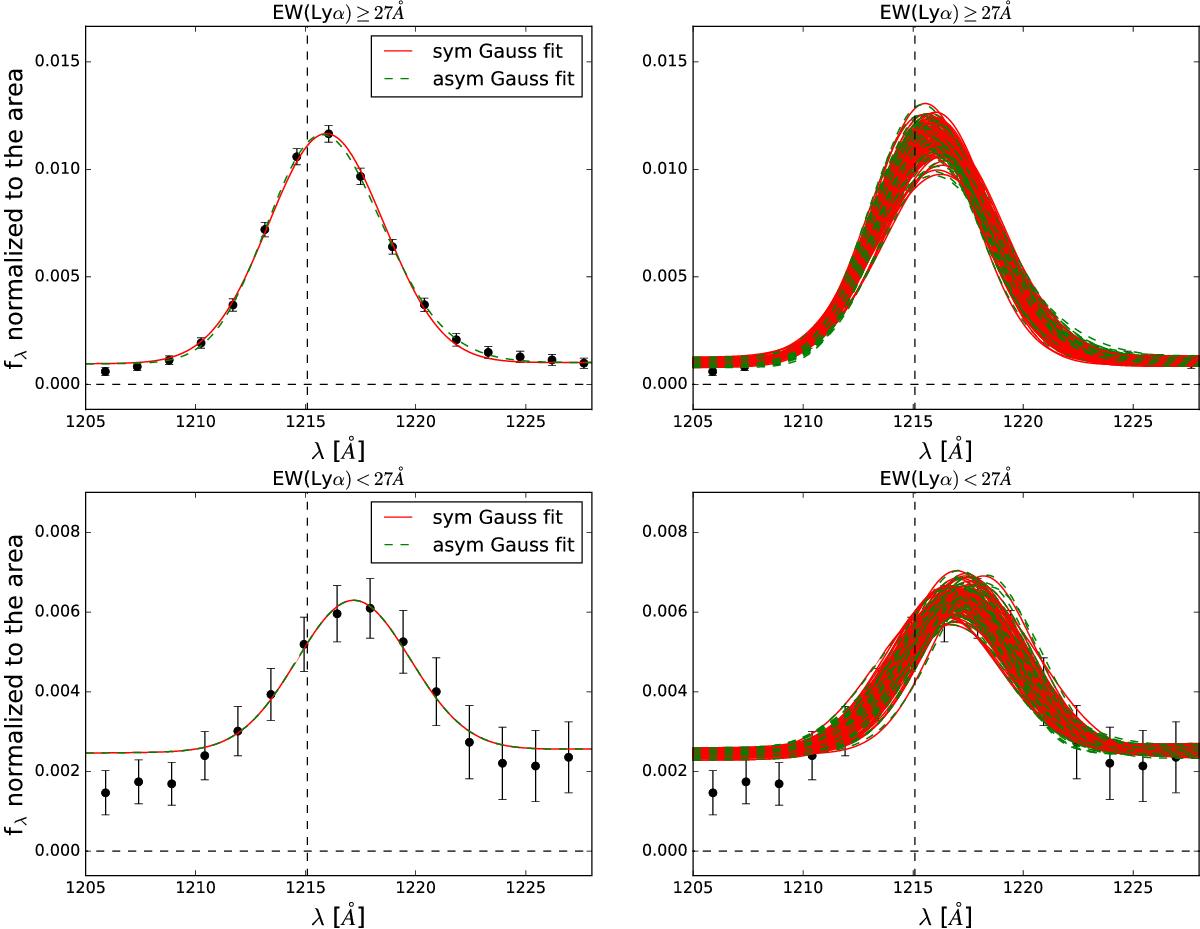
Flux density (fλ) normalized to the area below the curves of the Lyα (black dots) emission line. We present the 1D-stack line of the subsample of the galaxies with EW(Lyα) ≥ 27 Å on the top and with EW(Lyα) < 27 Å on the bottom panel. In the left panels, we show the symmetric (red) and asymmetric (green) Gaussian best fits. In the right panels, we show the best fits of the 100 realizations of the same line generated to calculate the bootstrap uncertainties. For the EW(Lyα) ≥ 27 Å subsample, the Lyα peak shift from the symmetric (asymmetric) Gaussian fit is 196 ± 60 km s-1 (163 ± 63 km s-1). For the EW(Lyα) < 27 Å subsample, it is 510 ± 98 km s-1 (516 ± 114 km s-1) for the symmetric (asymmetric) Gaussian fit.
Current usage metrics show cumulative count of Article Views (full-text article views including HTML views, PDF and ePub downloads, according to the available data) and Abstracts Views on Vision4Press platform.
Data correspond to usage on the plateform after 2015. The current usage metrics is available 48-96 hours after online publication and is updated daily on week days.
Initial download of the metrics may take a while.