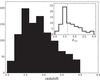
Fig. 1
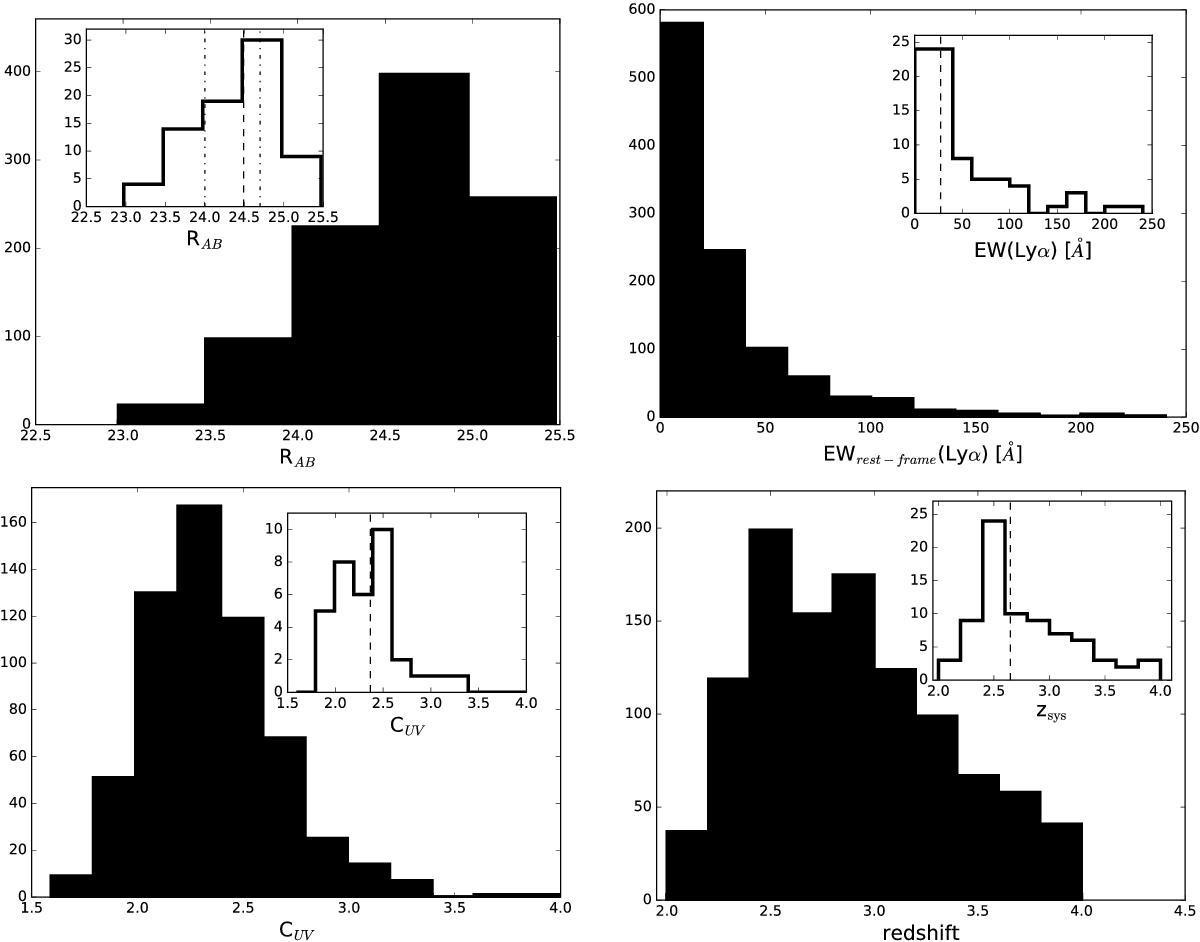
Distribution of R magnitude (top left), EW(Lyα) (top right), rest-frame UV concentration (bottom left), redshift (bottom right) of our sample of 76 sources (empty histograms in the inserts). Filled histograms correspond to the distributions of the 1070 Lyα emitting galaxies at 2 < z < 4. The vertical dashed lines indicate the median value of each histogram. In the top left panel, the dot-dashed vertical lines indicate the median R values of the two bins obtained, separating the sample with respect to the median of the 76-galaxy distribution.
Current usage metrics show cumulative count of Article Views (full-text article views including HTML views, PDF and ePub downloads, according to the available data) and Abstracts Views on Vision4Press platform.
Data correspond to usage on the plateform after 2015. The current usage metrics is available 48-96 hours after online publication and is updated daily on week days.
Initial download of the metrics may take a while.