Fig. 9
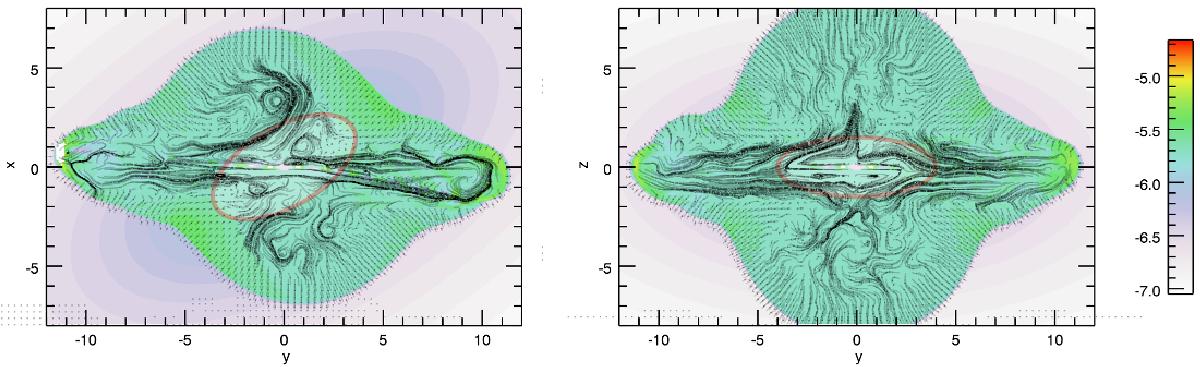
2D cuts of the pressure distribution in the yx (on the left) and yz (on the right) planes for case F, at the time when the cocoon has reached a size of approximately 24 kpc in the y direction. Superimposed we show also the velocity field. The red ellipses represents equicontours of the initial density distribution and indicate the relative orientation of the jet with respect to the density distribution.
Current usage metrics show cumulative count of Article Views (full-text article views including HTML views, PDF and ePub downloads, according to the available data) and Abstracts Views on Vision4Press platform.
Data correspond to usage on the plateform after 2015. The current usage metrics is available 48-96 hours after online publication and is updated daily on week days.
Initial download of the metrics may take a while.