Fig. 7
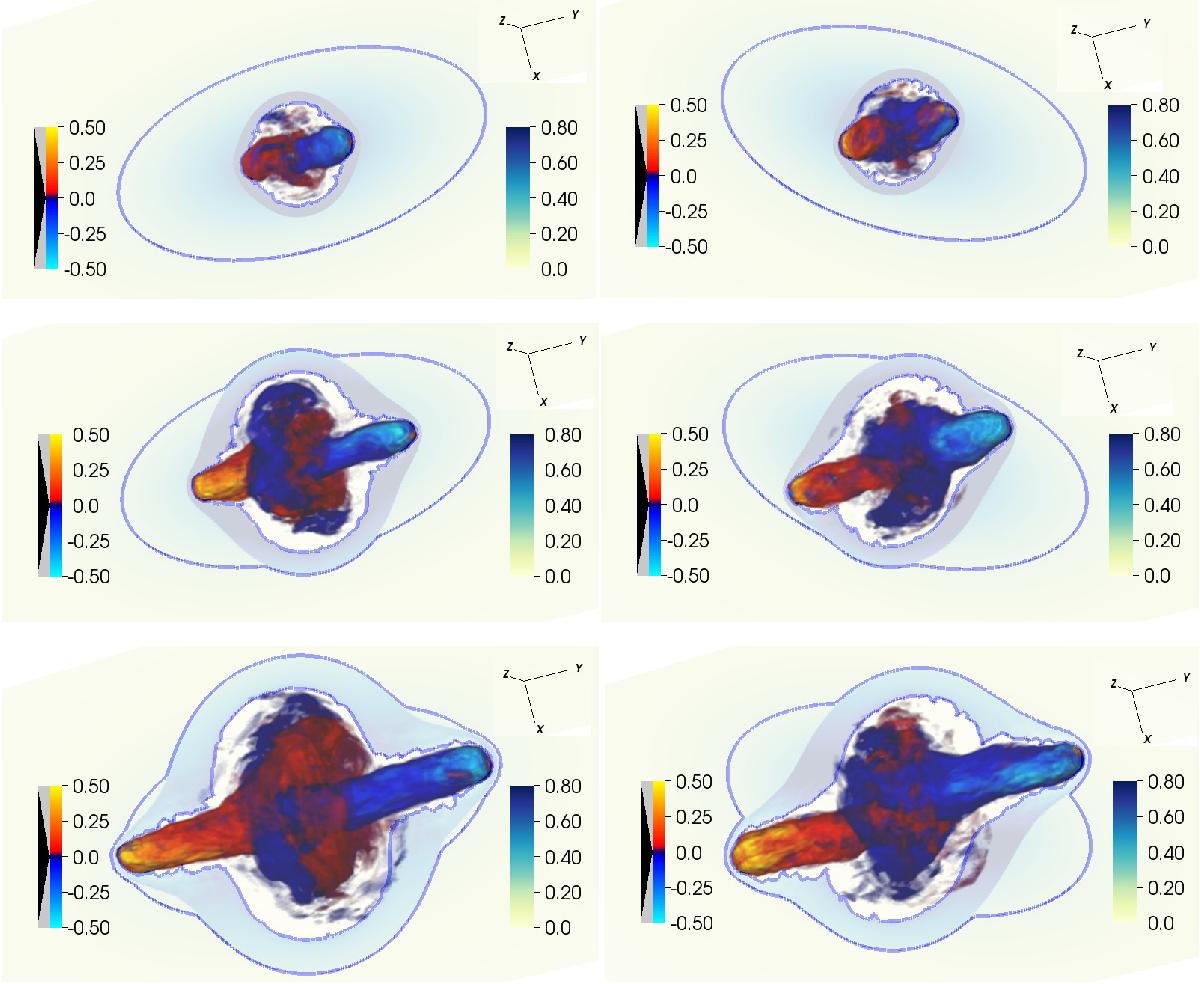
Evolution of cases E and F. The three panels on the left are for case E at times respectively 9.6 × 10⁵ yr, 1.8 × 10⁶ yr, and 2.6 × 10⁶ yr, from top to bottom, while the three panels on the right are for case F at times respectively 9.6 × 10⁵ yr, 1.6 × 10⁶ yr, 2.3 × 10⁶ yr, from top to bottom. The distribution of y velocity component is represented by a volume rendering, with blue colors representing negative values and red-yellow colors representing positive values. Superimposed, we also show a cut of the density distribution in the x-y plane, while the blue lines are density iso-contours at ρ = 0.2 cm-3 on the same plane.
Current usage metrics show cumulative count of Article Views (full-text article views including HTML views, PDF and ePub downloads, according to the available data) and Abstracts Views on Vision4Press platform.
Data correspond to usage on the plateform after 2015. The current usage metrics is available 48-96 hours after online publication and is updated daily on week days.
Initial download of the metrics may take a while.