Fig. 3
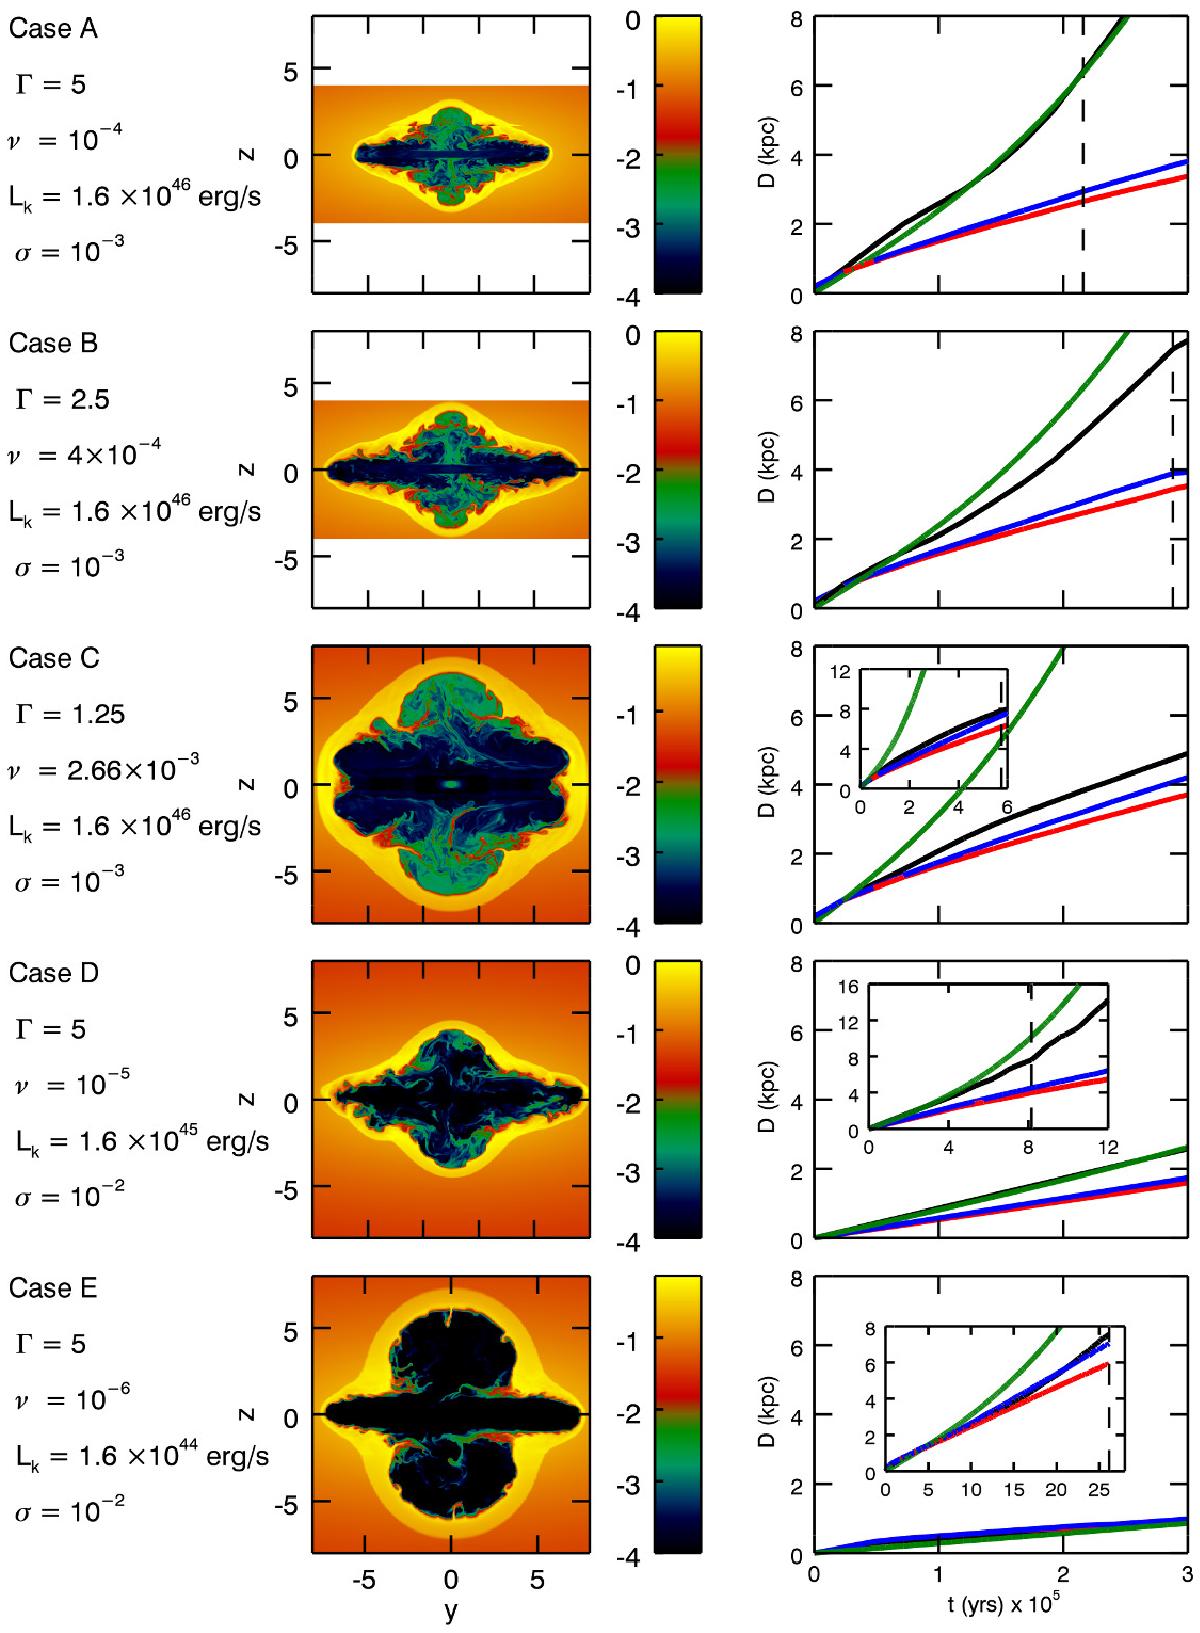
The panels in the central column show 2D cuts of the logarithmic density distributions in the yz plane for cases A to E, at the time when the cocoon has reached a size of approximately 8 kpc in the y direction (the times of each snapshot is shown in the right panels by the vertical dashed lines). The density is in units of ρ0. The right panels show plots of the cocoon size along the three axes (black along y, blue along z and red along x) as a function of time up to 3 × 10⁵ yr, we recall that the z direction corresponds to the minor axis, while the x direction corresponds to the intermediate axis. The green lines show the theoretical estimate of the jet head position based on Eq. (10)Since the expansion of cases C, D and E is slower, the insets in the three bottom figures show the evolution for later times. The parameters for each case are given on the left.
Current usage metrics show cumulative count of Article Views (full-text article views including HTML views, PDF and ePub downloads, according to the available data) and Abstracts Views on Vision4Press platform.
Data correspond to usage on the plateform after 2015. The current usage metrics is available 48-96 hours after online publication and is updated daily on week days.
Initial download of the metrics may take a while.