Fig. 2
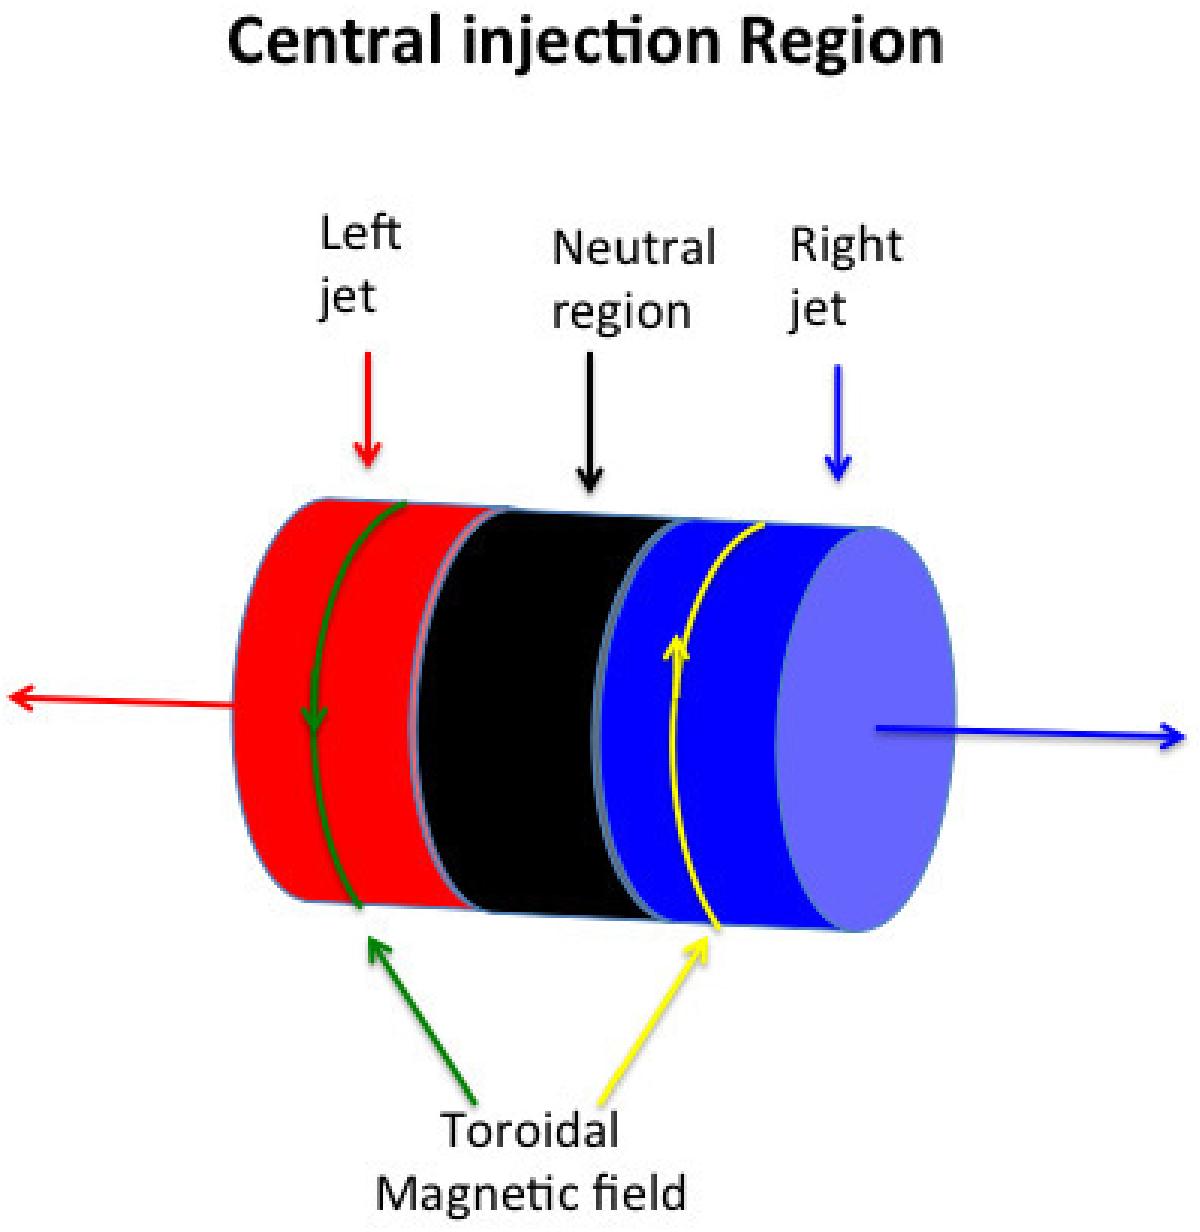
Sketch of the cylindrical injection region which represents an internal boundary in which the variables are kept fixed to the injection values. In the black part velocity and magnetic field are kept equal to zero, in the blue and red regions velocities are opposite and from these two regions two opposite jets are injected. The blue and red arrows show the velocity directions, while the arrows on the yellow and green lines show the direction of the toroidal magnetic field.
Current usage metrics show cumulative count of Article Views (full-text article views including HTML views, PDF and ePub downloads, according to the available data) and Abstracts Views on Vision4Press platform.
Data correspond to usage on the plateform after 2015. The current usage metrics is available 48-96 hours after online publication and is updated daily on week days.
Initial download of the metrics may take a while.