Fig. 2
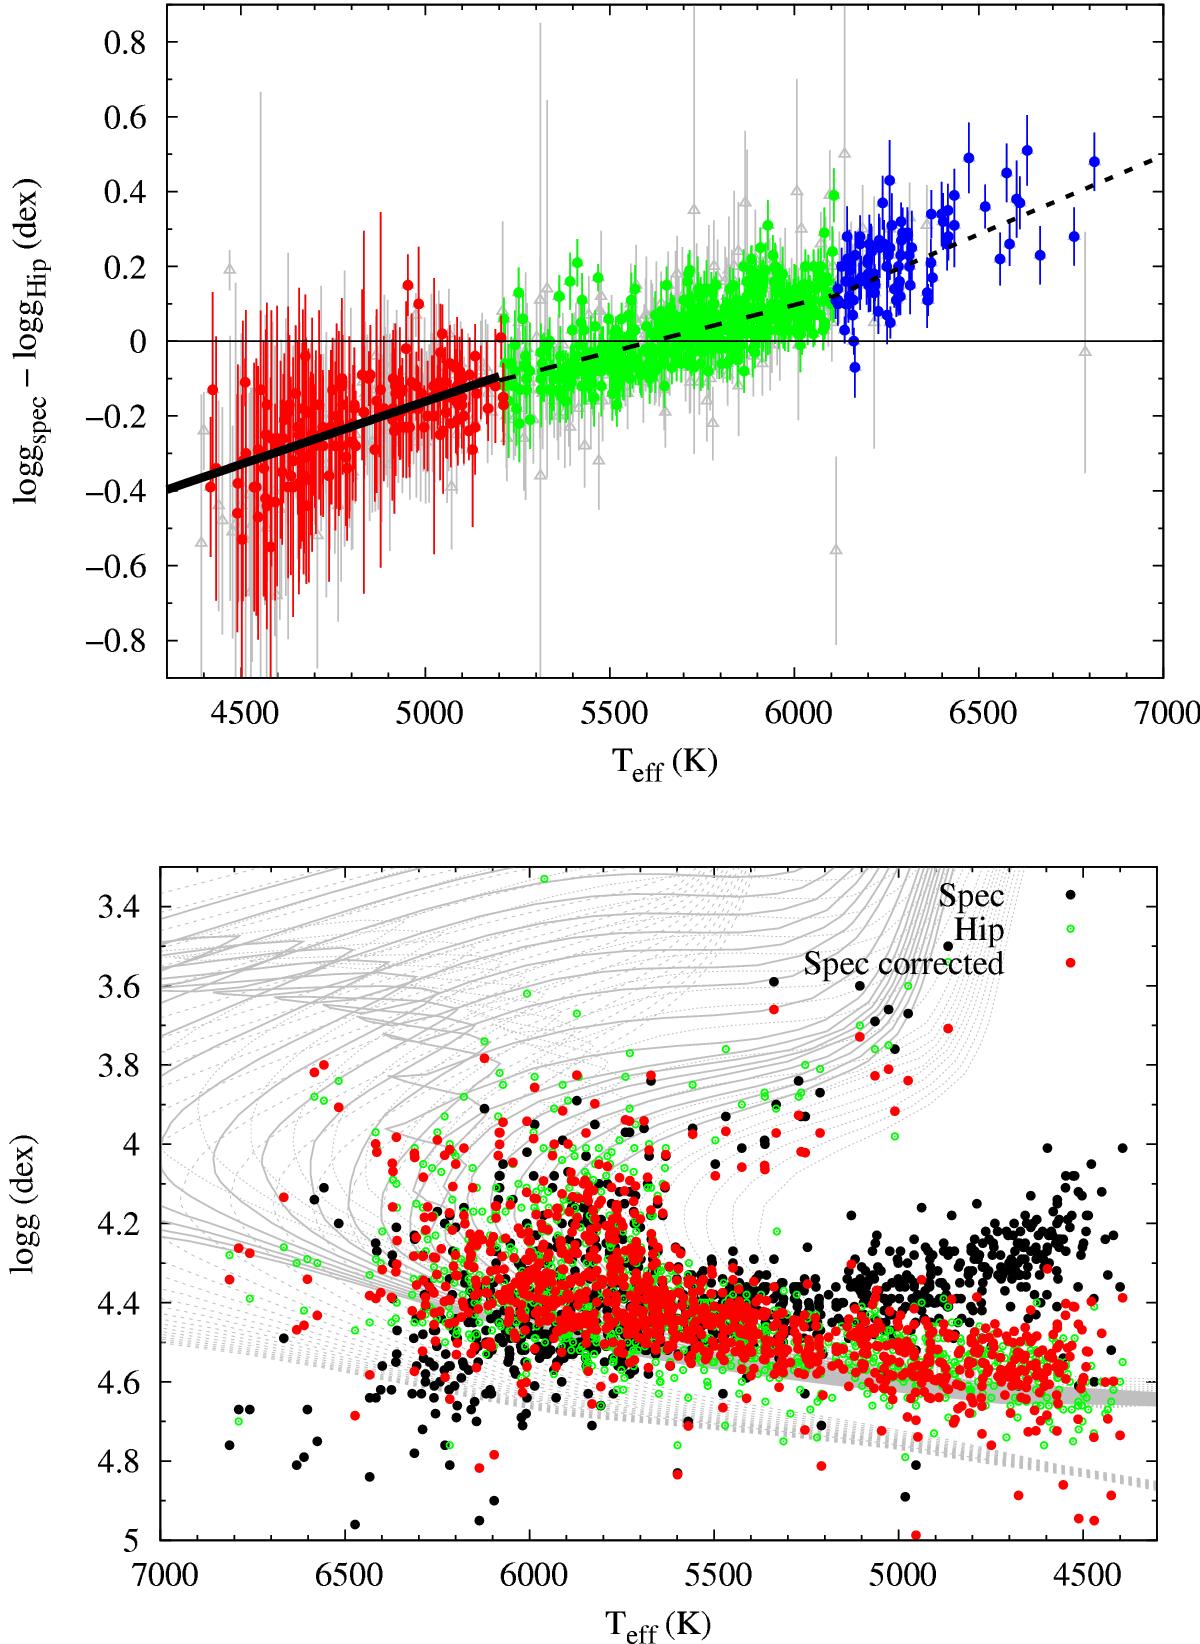
Upper panel: comparison between the log g from spectroscopy and that derived from Hipparcos parallaxes as a function of Teff. The different lines represent linear fits in three different Teff bins. The stars with error in parallax higher than 5% (not considered for the fit) are represented by grey triangles. Lower panel: HR diagram with our spectroscopic log g, our corrected log g values, and the log g using the Hipparcos parallaxes.
Current usage metrics show cumulative count of Article Views (full-text article views including HTML views, PDF and ePub downloads, according to the available data) and Abstracts Views on Vision4Press platform.
Data correspond to usage on the plateform after 2015. The current usage metrics is available 48-96 hours after online publication and is updated daily on week days.
Initial download of the metrics may take a while.