Free Access
Fig. 19
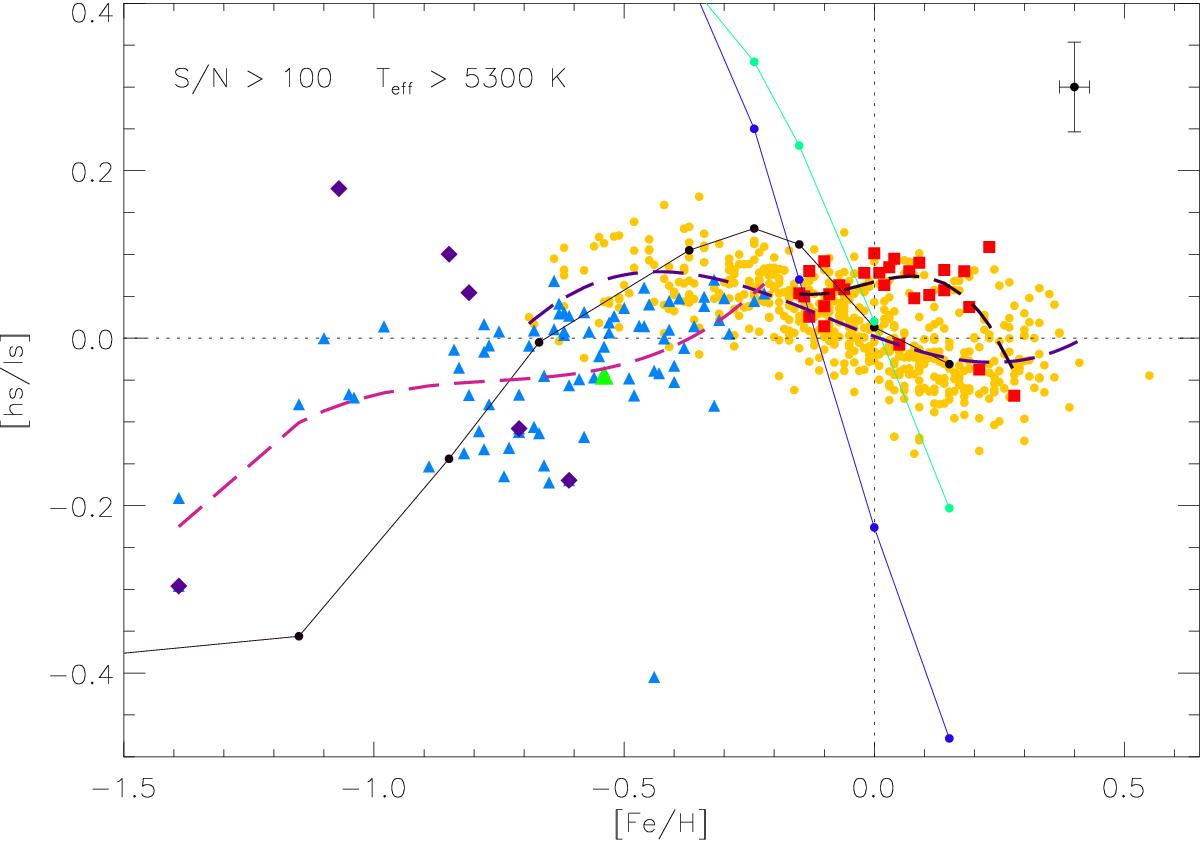
Ratios of heavy-s to light-s as a function of [Fe/H] for stars with Teff> 5300 K and S/N > 100. Symbols as in Fig. 10. The blue, green, and black lines are AGB models of 2 M⊙, 3 M⊙, and 6 M⊙, respectively, from Cristallo et al. (2015b). The long-dashed lines are polynomial fits to the different populations.
Current usage metrics show cumulative count of Article Views (full-text article views including HTML views, PDF and ePub downloads, according to the available data) and Abstracts Views on Vision4Press platform.
Data correspond to usage on the plateform after 2015. The current usage metrics is available 48-96 hours after online publication and is updated daily on week days.
Initial download of the metrics may take a while.