Fig. 4
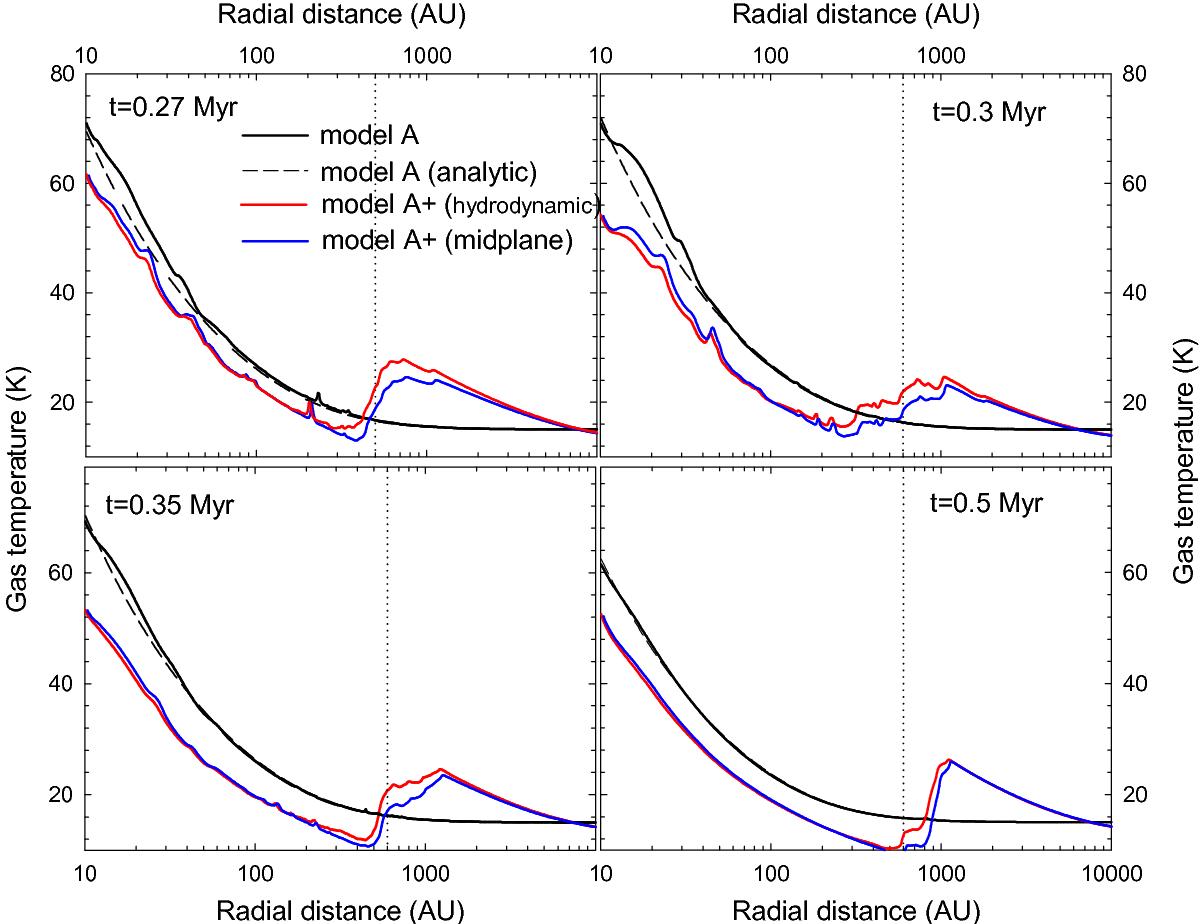
Azimuthally averaged radial profiles of the gas temperature in model A+ (red and blue lines) and model A (black solid lines) taken at several times since onset of numerical simulations. In particular, the red lines represent the gas temperature mass-weighted over the vertical column of gas, while the blue lines are the gas temperature in the disk midplane. The dashed solid lines are the gas temperatures in model A derived for the steady-state case neglecting compressional and viscous heating. The vertical dotted lines mark the radial positions where the disk joins the infalling envelope.
Current usage metrics show cumulative count of Article Views (full-text article views including HTML views, PDF and ePub downloads, according to the available data) and Abstracts Views on Vision4Press platform.
Data correspond to usage on the plateform after 2015. The current usage metrics is available 48-96 hours after online publication and is updated daily on week days.
Initial download of the metrics may take a while.