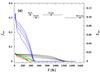
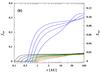
Fig. 4

Panel a: variation with temperature of the fractions (left scale) of the carbon that is bound into one of the solid carbonaceous phase at the mid-plane of the disc model after 0.2, 0.5, 1, and 2 Ma of disc evolution (from the lower to the upper curves in each group, respectively). Black lines show amorphous carbon. Blue lines depict refractory organic material (CHON). Moderately volatile organics are delineated with green lines, and volatile organic material with red lines. The black dots with a horizontal bar indicate the possible range of temperatures in the feeding zones, which mainly contribute material to the planets. The right scale shows the mass fraction of carbon contained in dust grains. Panel b: radial variation of the fractions of all components of the carbonaceous material at the mid-plane of the disc model after 0.2, 0.5, 1, and 2 Ma of disc evolution (lower to upper curves for r< 10 AU).
Current usage metrics show cumulative count of Article Views (full-text article views including HTML views, PDF and ePub downloads, according to the available data) and Abstracts Views on Vision4Press platform.
Data correspond to usage on the plateform after 2015. The current usage metrics is available 48-96 hours after online publication and is updated daily on week days.
Initial download of the metrics may take a while.